Estimated Value: $525,000 - $532,142
5
Beds
3
Baths
3,620
Sq Ft
$146/Sq Ft
Est. Value
About This Home
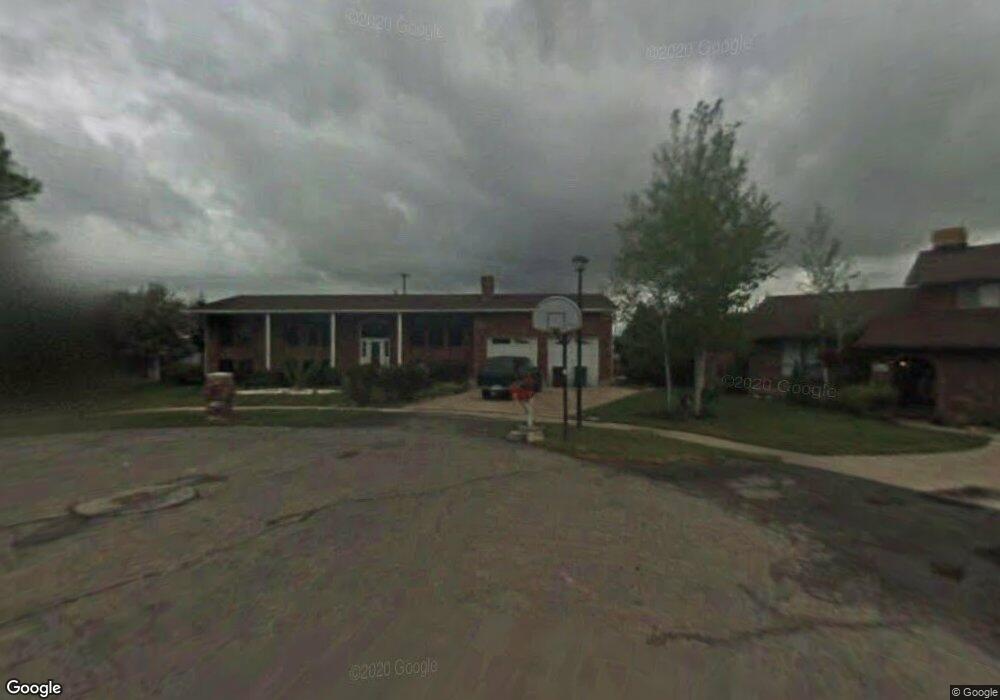
This home is located at 4427 S 1620 W, Roy, UT 84067 and is currently estimated at $529,536, approximately $146 per square foot. 4427 S 1620 W is a home located in Weber County with nearby schools including North Park School, Sand Ridge Junior High School, and Roy High School.
Ownership History
Date
Name
Owned For
Owner Type
Purchase Details
Closed on
Nov 23, 2005
Sold by
Layton Steven D
Bought by
Pagano David C and Pagano Margie E
Current Estimated Value
Home Financials for this Owner
Home Financials are based on the most recent Mortgage that was taken out on this home.
Original Mortgage
$197,900
Outstanding Balance
$109,095
Interest Rate
6.14%
Mortgage Type
Fannie Mae Freddie Mac
Estimated Equity
$420,441
Purchase Details
Closed on
Jun 17, 2005
Sold by
Sdl Enterprises Llc
Bought by
Layton Steven D
Home Financials for this Owner
Home Financials are based on the most recent Mortgage that was taken out on this home.
Original Mortgage
$142,500
Interest Rate
5.72%
Mortgage Type
Credit Line Revolving
Purchase Details
Closed on
May 11, 2005
Sold by
Tingey Randy M and Tingey Robin
Bought by
Sdl Enterprises Llc
Home Financials for this Owner
Home Financials are based on the most recent Mortgage that was taken out on this home.
Original Mortgage
$142,500
Interest Rate
5.72%
Mortgage Type
Credit Line Revolving
Create a Home Valuation Report for This Property
The Home Valuation Report is an in-depth analysis detailing your home's value as well as a comparison with similar homes in the area
Home Values in the Area
Average Home Value in this Area
Purchase History
| Date | Buyer | Sale Price | Title Company |
|---|---|---|---|
| Pagano David C | -- | Mountain View Title Ogden | |
| Layton Steven D | -- | Lincoln Title Insurance Agen | |
| Sdl Enterprises Llc | $152,966 | -- |
Source: Public Records
Mortgage History
| Date | Status | Borrower | Loan Amount |
|---|---|---|---|
| Open | Pagano David C | $197,900 | |
| Previous Owner | Layton Steven D | $142,500 |
Source: Public Records
Tax History Compared to Growth
Tax History
| Year | Tax Paid | Tax Assessment Tax Assessment Total Assessment is a certain percentage of the fair market value that is determined by local assessors to be the total taxable value of land and additions on the property. | Land | Improvement |
|---|---|---|---|---|
| 2025 | $3,474 | $564,893 | $158,653 | $406,240 |
| 2024 | $3,389 | $305,249 | $87,267 | $217,982 |
| 2023 | $3,207 | $288,750 | $83,885 | $204,865 |
| 2022 | $3,093 | $284,900 | $67,205 | $217,695 |
| 2021 | $2,585 | $392,000 | $86,624 | $305,376 |
| 2020 | $2,343 | $325,000 | $86,624 | $238,376 |
| 2019 | $2,427 | $319,000 | $51,243 | $267,757 |
| 2018 | $2,303 | $285,000 | $46,280 | $238,720 |
| 2017 | $2,173 | $252,000 | $46,280 | $205,720 |
| 2016 | $2,093 | $130,586 | $25,110 | $105,476 |
| 2015 | $2,033 | $130,586 | $22,378 | $108,208 |
| 2014 | $2,052 | $130,586 | $22,378 | $108,208 |
Source: Public Records
Map
Nearby Homes
- 1681 W 4450 S
- 4438 S 1700 W
- 4552 S 1675 W
- 4502 S 1720 W
- 4501 S 1720 W
- 4593 Promenade Dr
- 1766 W 4575 S
- 1825 W 4400 S
- 1825 W 4500 S Unit 101
- 4602 Hathaway Dr
- 4536 S 1900 W Unit 12
- 4642 S 1900 W Unit 41
- 1219 W 4500 S
- 1190 W 4575 S
- 4475 S 1975 W
- 2038 W 4600 S
- 2015 W 4225 S
- 2082 W 4450 S
- 1789 W 5000 S
- 5006 S 1800 W