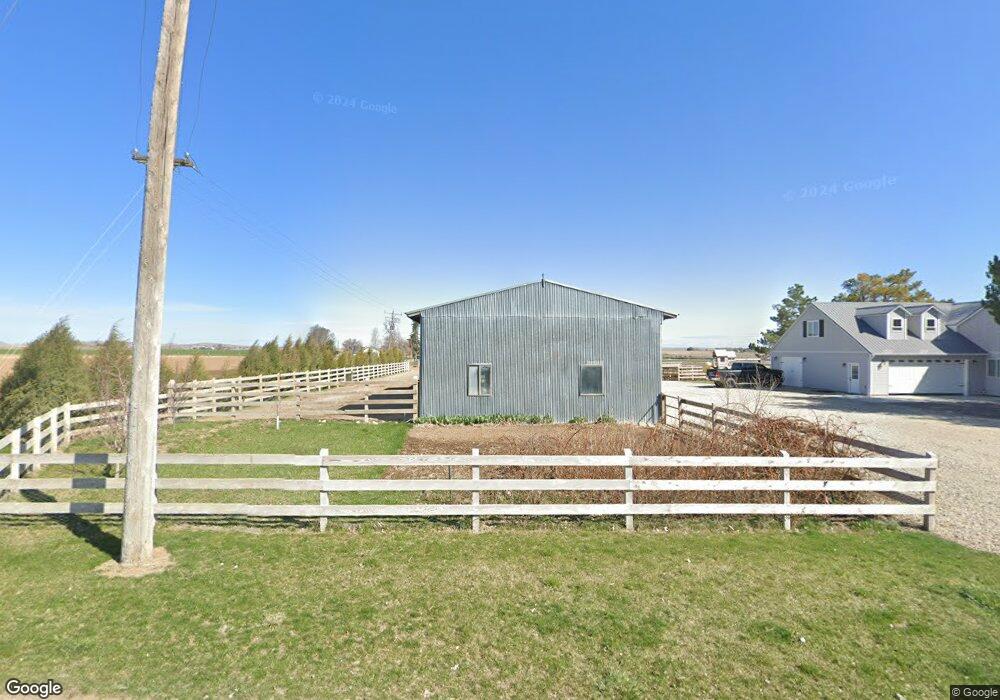
4428 E 3600 N Murtaugh, ID 83344
Estimated Value: $465,000 - $549,814
2
Beds
1
Bath
2,140
Sq Ft
$242/Sq Ft
Est. Value
About This Home
This home is located at 4428 E 3600 N, Murtaugh, ID 83344 and is currently estimated at $518,454, approximately $242 per square foot. 4428 E 3600 N is a home located in Twin Falls County with nearby schools including Murtaugh Schools.
Ownership History
Date
Name
Owned For
Owner Type
Purchase Details
Closed on
Feb 17, 2017
Sold by
Widmier Reese A
Bought by
Widmier Reese A and Widmier Paige L
Current Estimated Value
Home Financials for this Owner
Home Financials are based on the most recent Mortgage that was taken out on this home.
Original Mortgage
$266,385
Outstanding Balance
$222,021
Interest Rate
4.12%
Mortgage Type
New Conventional
Estimated Equity
$296,433
Purchase Details
Closed on
Jan 30, 2012
Sold by
Toupin Jane
Bought by
Toupin Jane D
Purchase Details
Closed on
Sep 26, 2011
Sold by
Widmier Paige L
Bought by
Widmier Reese A
Home Financials for this Owner
Home Financials are based on the most recent Mortgage that was taken out on this home.
Original Mortgage
$4,550
Interest Rate
4.09%
Mortgage Type
Purchase Money Mortgage
Create a Home Valuation Report for This Property
The Home Valuation Report is an in-depth analysis detailing your home's value as well as a comparison with similar homes in the area
Purchase History
| Date | Buyer | Sale Price | Title Company |
|---|---|---|---|
| Widmier Reese A | -- | Titleone Twin Falls | |
| Toupin Jane D | -- | Alliance Title | |
| Widmier Reese A | -- | -- | |
| Widmier Reese A | -- | -- |
Source: Public Records
Mortgage History
| Date | Status | Borrower | Loan Amount |
|---|---|---|---|
| Open | Widmier Reese A | $266,385 | |
| Previous Owner | Widmier Reese A | $4,550 | |
| Previous Owner | Widmier Reese A | $126,704 |
Source: Public Records
Tax History Compared to Growth
Tax History
| Year | Tax Paid | Tax Assessment Tax Assessment Total Assessment is a certain percentage of the fair market value that is determined by local assessors to be the total taxable value of land and additions on the property. | Land | Improvement |
|---|---|---|---|---|
| 2025 | $2,124 | $460,199 | $79,253 | $380,946 |
| 2024 | $2,102 | $460,199 | $79,253 | $380,946 |
| 2023 | $2,727 | $475,534 | $79,253 | $396,281 |
| 2022 | $3,300 | $466,082 | $65,665 | $400,417 |
| 2021 | $2,779 | $359,584 | $48,358 | $311,226 |
| 2020 | $2,298 | $279,146 | $48,358 | $230,788 |
| 2019 | $2,073 | $255,923 | $29,098 | $226,825 |
| 2018 | $975 | $158,644 | $29,098 | $129,546 |
| 2017 | $882 | $142,449 | $29,098 | $113,351 |
| 2016 | $751 | $119,689 | $0 | $0 |
| 2015 | $772 | $119,689 | $29,098 | $90,591 |
| 2012 | -- | $110,811 | $0 | $0 |
Source: Public Records
Map
Nearby Homes