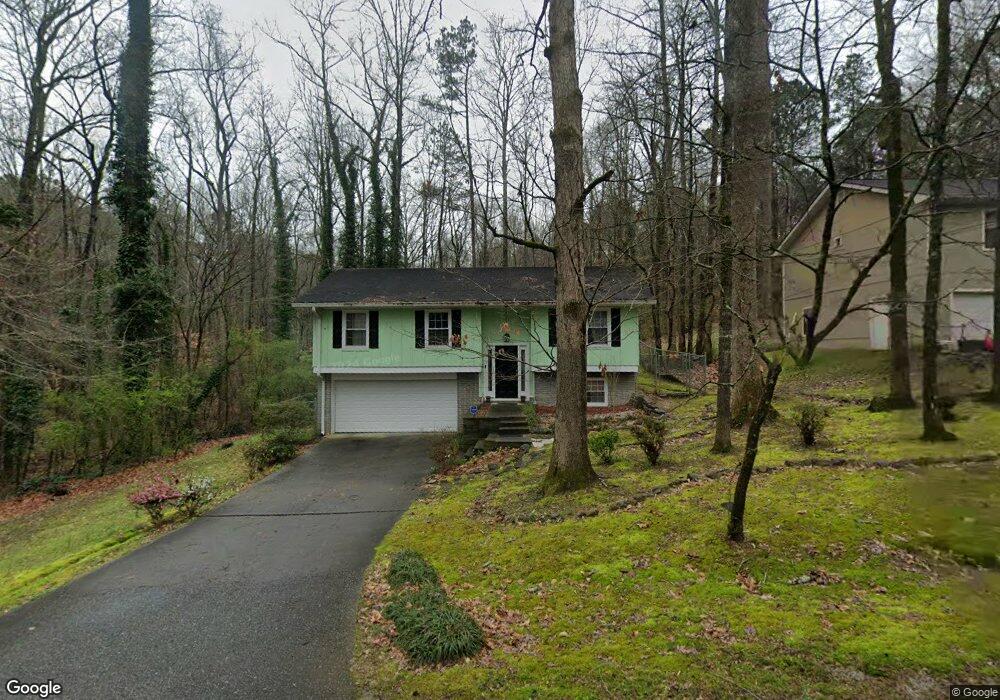
4428 Marjorie Rd Snellville, GA 30039
Estimated Value: $242,000 - $268,000
3
Beds
2
Baths
1,459
Sq Ft
$176/Sq Ft
Est. Value
About This Home
This home is located at 4428 Marjorie Rd, Snellville, GA 30039 and is currently estimated at $256,383, approximately $175 per square foot. 4428 Marjorie Rd is a home located in Gwinnett County with nearby schools including Anderson-Livsey Elementary School, Shiloh Middle School, and Shiloh High School.
Ownership History
Date
Name
Owned For
Owner Type
Purchase Details
Closed on
Apr 23, 2021
Sold by
Opendoor Property Trust I
Bought by
Resicap Georgia Owner Llc
Current Estimated Value
Purchase Details
Closed on
Mar 18, 2021
Sold by
Duffus Lenval
Bought by
Opendoor Property Trust I
Purchase Details
Closed on
Dec 4, 2020
Sold by
Lawrence Susan
Bought by
Duffus Lenval
Purchase Details
Closed on
Dec 18, 2006
Sold by
Pelican Finl Llc
Bought by
Duffus Lenval
Home Financials for this Owner
Home Financials are based on the most recent Mortgage that was taken out on this home.
Original Mortgage
$135,572
Interest Rate
6.19%
Mortgage Type
FHA
Purchase Details
Closed on
Jun 15, 2004
Sold by
Bowlin Investment Group Inc
Bought by
Pelican Financial Llc
Purchase Details
Closed on
Apr 7, 2003
Sold by
Gilmore Sandra L
Bought by
Bowlin Investments Group Inc
Home Financials for this Owner
Home Financials are based on the most recent Mortgage that was taken out on this home.
Original Mortgage
$92,000
Interest Rate
5.62%
Create a Home Valuation Report for This Property
The Home Valuation Report is an in-depth analysis detailing your home's value as well as a comparison with similar homes in the area
Home Values in the Area
Average Home Value in this Area
Purchase History
| Date | Buyer | Sale Price | Title Company |
|---|---|---|---|
| Resicap Georgia Owner Llc | $160,500 | -- | |
| Opendoor Property Trust I | $158,500 | -- | |
| Duffus Lenval | -- | -- | |
| Duffus Lenval | $137,700 | -- | |
| Pelican Financial Llc | -- | -- | |
| Bowlin Investments Group Inc | $76,000 | -- |
Source: Public Records
Mortgage History
| Date | Status | Borrower | Loan Amount |
|---|---|---|---|
| Previous Owner | Duffus Lenval | $135,572 | |
| Previous Owner | Bowlin Investments Group Inc | $92,000 |
Source: Public Records
Tax History Compared to Growth
Tax History
| Year | Tax Paid | Tax Assessment Tax Assessment Total Assessment is a certain percentage of the fair market value that is determined by local assessors to be the total taxable value of land and additions on the property. | Land | Improvement |
|---|---|---|---|---|
| 2024 | $3,659 | $94,360 | $20,000 | $74,360 |
| 2023 | $3,659 | $98,720 | $20,000 | $78,720 |
| 2022 | $2,552 | $64,200 | $14,000 | $50,200 |
| 2021 | $1,691 | $50,720 | $10,000 | $40,720 |
| 2020 | $1,701 | $50,720 | $10,000 | $40,720 |
| 2019 | $1,523 | $44,400 | $10,000 | $34,400 |
| 2018 | $1,518 | $44,400 | $10,000 | $34,400 |
| 2016 | $1,223 | $33,080 | $8,000 | $25,080 |
| 2015 | $906 | $23,800 | $4,800 | $19,000 |
| 2014 | -- | $23,800 | $4,800 | $19,000 |
Source: Public Records
Map
Nearby Homes
- 4432 Marjorie Rd
- 4421 Marjorie Rd SW
- 4421 Marjorie Rd
- 4440 Marjorie Rd
- 4425 Marjorie Rd
- 4439 Marjorie Rd
- 4408 Marjorie Rd
- 4444 Marjorie Rd
- 4447 Marjorie Rd
- 4450 Cary Dr
- 4456 Marjorie Rd
- 4520 Bridle Park Pkwy
- 4395 Marjorie Rd
- 4392 Marjorie Rd
- 4461 Marjorie Rd
- 4460 Marjorie Rd
- 4457 Cary Dr
- 4401 Bradley Dr
- 4449 Cary Dr
- 4428 Cary Dr