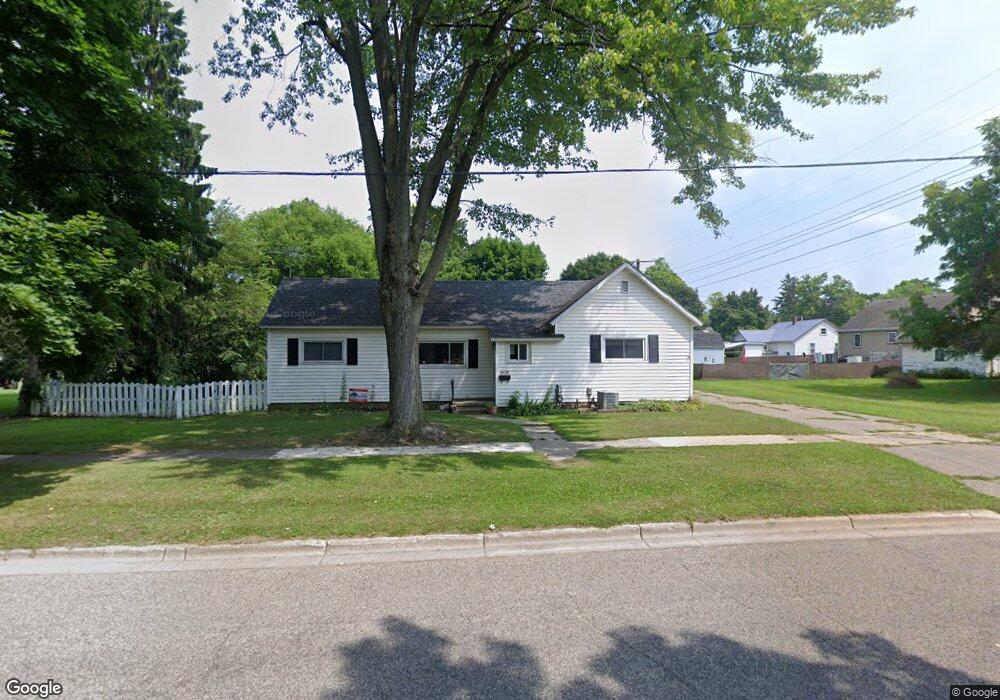
4428 Sherman St Cass City, MI 48726
Estimated Value: $90,000 - $138,000
3
Beds
1
Bath
1,012
Sq Ft
$116/Sq Ft
Est. Value
About This Home
This home is located at 4428 Sherman St, Cass City, MI 48726 and is currently estimated at $117,395, approximately $116 per square foot. 4428 Sherman St is a home located in Tuscola County with nearby schools including Cass City Elementary School and Cass City Junior/Senior High School.
Ownership History
Date
Name
Owned For
Owner Type
Purchase Details
Closed on
Oct 12, 2022
Sold by
Mcclorey Deborah
Bought by
Warren Jessica and Warren Thomas
Current Estimated Value
Home Financials for this Owner
Home Financials are based on the most recent Mortgage that was taken out on this home.
Original Mortgage
$93,279
Outstanding Balance
$89,519
Interest Rate
5.66%
Mortgage Type
FHA
Estimated Equity
$27,876
Purchase Details
Closed on
Aug 31, 2017
Sold by
Mcclorey Brian Michael
Bought by
Mcclorey Deborah Leigh
Purchase Details
Closed on
Jun 13, 2013
Sold by
Osentoski Tavis and Osentoski Kenneth
Bought by
Mcclorey Brian M and Mcclorey Deborah L
Purchase Details
Closed on
Dec 7, 2011
Sold by
Osentoski Kenneth
Bought by
Osentoski Tavis and Osentoski Kenneth
Purchase Details
Closed on
Aug 30, 2011
Sold by
Fannie Mae
Bought by
Bliss Nick
Purchase Details
Closed on
Dec 2, 2010
Sold by
The Federal National Mortgage Ass
Bought by
Guinther Trina A
Create a Home Valuation Report for This Property
The Home Valuation Report is an in-depth analysis detailing your home's value as well as a comparison with similar homes in the area
Home Values in the Area
Average Home Value in this Area
Purchase History
| Date | Buyer | Sale Price | Title Company |
|---|---|---|---|
| Warren Jessica | $95,000 | -- | |
| Mcclorey Deborah Leigh | -- | None Available | |
| Mcclorey Brian M | $26,000 | None Available | |
| Osentoski Tavis | -- | None Available | |
| Bliss Nick | $25,500 | None Available | |
| Osentoski Kenneth | -- | None Available | |
| Guinther Trina A | $71,338 | None Available |
Source: Public Records
Mortgage History
| Date | Status | Borrower | Loan Amount |
|---|---|---|---|
| Open | Warren Jessica | $93,279 |
Source: Public Records
Tax History Compared to Growth
Tax History
| Year | Tax Paid | Tax Assessment Tax Assessment Total Assessment is a certain percentage of the fair market value that is determined by local assessors to be the total taxable value of land and additions on the property. | Land | Improvement |
|---|---|---|---|---|
| 2025 | $1,638 | $41,700 | $0 | $0 |
| 2024 | $1,638 | $40,900 | $0 | $0 |
| 2023 | $926 | $34,900 | $0 | $0 |
| 2022 | $940 | $29,700 | $0 | $0 |
| 2021 | $1,280 | $27,200 | $0 | $0 |
| 2020 | $1,265 | $22,600 | $0 | $0 |
| 2019 | $881 | $19,700 | $0 | $0 |
| 2018 | $1,250 | $21,100 | $0 | $0 |
| 2017 | $1,205 | $21,500 | $0 | $0 |
| 2016 | $1,184 | $21,100 | $0 | $0 |
| 2015 | $6 | $19,200 | $0 | $0 |
| 2014 | $6 | $19,200 | $0 | $0 |
| 2013 | $4 | $20,000 | $0 | $0 |
Source: Public Records
Map
Nearby Homes
- 4286 Oak St
- 4567 Seeger St
- 4659 Seeger St
- 6276 Pine St
- 4633 Huron St
- Vacant land Doerr Rd
- 0 Chippewa Trail Unit 20240025599
- 0 Seeger St
- 3803 Warner Rd
- 2665 N Cemetery Rd
- V/L Warner Rd
- 5730 Van Dyke Rd
- 4792 State St
- 4307 Hobart Rd
- 5831 Reed St
- 0 Deckerville Deckerville Rd
- 3151 Mcgregory Rd
- 0000 Cooklin Rd
- 5357 Owendale Rd
- 2750 E Deckerville Rd