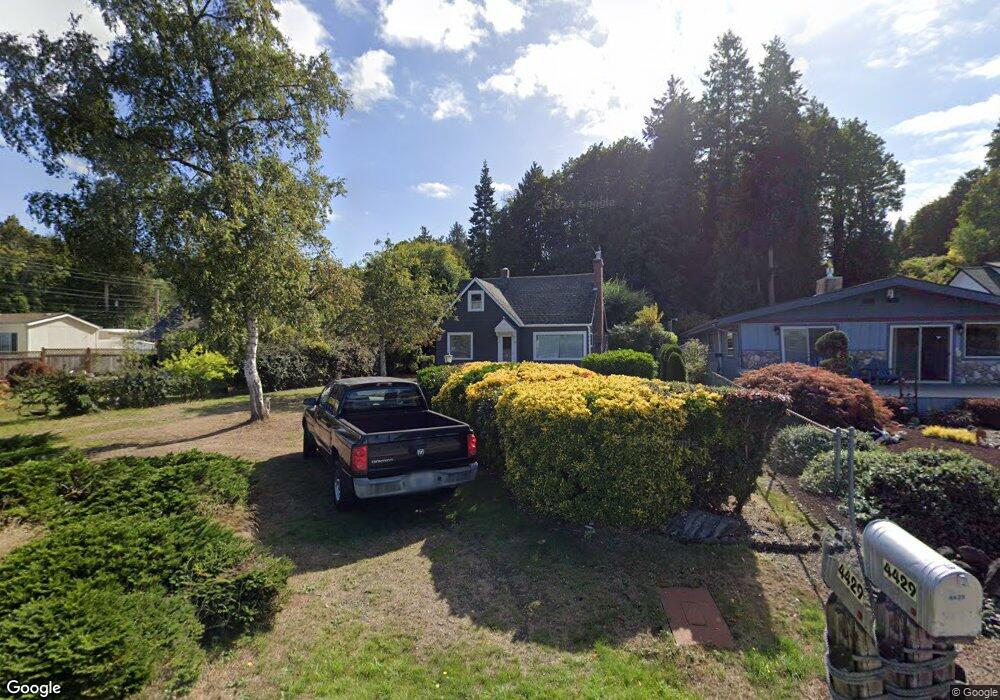
4429 Beach Dr E Port Orchard, WA 98366
Estimated Value: $458,000 - $648,000
3
Beds
1
Bath
994
Sq Ft
$515/Sq Ft
Est. Value
About This Home
This home is located at 4429 Beach Dr E, Port Orchard, WA 98366 and is currently estimated at $511,877, approximately $514 per square foot. 4429 Beach Dr E is a home with nearby schools including Orchard Heights Elementary School, Marcus Whitman Middle School, and South Kitsap High School.
Ownership History
Date
Name
Owned For
Owner Type
Purchase Details
Closed on
Dec 16, 2024
Sold by
Stewart Laurie Gardner and Stewart Colin
Bought by
Stewart Colin
Current Estimated Value
Home Financials for this Owner
Home Financials are based on the most recent Mortgage that was taken out on this home.
Original Mortgage
$2,454
Outstanding Balance
$2,435
Interest Rate
6.79%
Mortgage Type
New Conventional
Estimated Equity
$509,442
Purchase Details
Closed on
Dec 13, 2024
Sold by
Damgaard James G and Damgaard Michael
Bought by
Stewart Colin
Home Financials for this Owner
Home Financials are based on the most recent Mortgage that was taken out on this home.
Original Mortgage
$2,454
Outstanding Balance
$2,435
Interest Rate
6.79%
Mortgage Type
New Conventional
Estimated Equity
$509,442
Create a Home Valuation Report for This Property
The Home Valuation Report is an in-depth analysis detailing your home's value as well as a comparison with similar homes in the area
Home Values in the Area
Average Home Value in this Area
Purchase History
| Date | Buyer | Sale Price | Title Company |
|---|---|---|---|
| Stewart Colin | $313 | Fidelity National Title | |
| Stewart Colin | $313 | Fidelity National Title | |
| Stewart Colin | $450,000 | Fidelity National Title | |
| Stewart Colin | $450,000 | Fidelity National Title |
Source: Public Records
Mortgage History
| Date | Status | Borrower | Loan Amount |
|---|---|---|---|
| Open | Stewart Colin | $2,454 | |
| Closed | Stewart Colin | $2,454 |
Source: Public Records
Tax History Compared to Growth
Tax History
| Year | Tax Paid | Tax Assessment Tax Assessment Total Assessment is a certain percentage of the fair market value that is determined by local assessors to be the total taxable value of land and additions on the property. | Land | Improvement |
|---|---|---|---|---|
| 2026 | $3,782 | $433,590 | $241,770 | $191,820 |
| 2025 | $3,782 | $433,590 | $241,770 | $191,820 |
| 2024 | $3,668 | $433,590 | $241,770 | $191,820 |
| 2023 | $3,642 | $433,590 | $241,770 | $191,820 |
| 2022 | $3,499 | $348,460 | $193,790 | $154,670 |
| 2021 | $3,429 | $323,580 | $184,560 | $139,020 |
| 2020 | $2,870 | $261,560 | $142,420 | $119,140 |
| 2019 | $2,470 | $247,150 | $134,310 | $112,840 |
| 2018 | $2,525 | $204,840 | $121,580 | $83,260 |
| 2017 | $2,253 | $204,840 | $121,580 | $83,260 |
| 2016 | $2,339 | $195,270 | $115,790 | $79,480 |
| 2015 | $2,285 | $193,380 | $115,790 | $77,590 |
| 2014 | -- | $193,640 | $123,220 | $70,420 |
| 2013 | -- | $193,640 | $123,220 | $70,420 |
Source: Public Records
Map
Nearby Homes
- 4429 Waterman Ridge Ln E
- 5396 E Blaisdell Ln
- 3643 Beach Dr E
- 5172 Rich View Dr E
- 3538 Beach Dr E
- 5675 E Hillcrest Dr
- 7817 E Hilldale Rd
- 3193 Woods Rd E
- 0 Point White Dr NE
- 7021 Beach Dr E
- 0 Nevada Ave & Michigan St Unit NWM2365944
- 3200 Nevada East Ave
- 22 Lots Ave
- 6754 Missouri St E
- 7016 E Nightingale St
- 6997 E Bullseye St
- 7020 E Nightingale St
- 7058 E Nightingale St
- 7057 E Bullseye St
- 7081 E Bullseye St
- 4435 Beach Dr E
- 4423 Beach Dr E
- 4449 Beach Dr E Unit 1
- 4449 Beach Dr E Unit 24
- 4449 Beach Dr E Unit 12
- 4449 Beach Dr E Unit 14
- 4449 Beach Dr E Unit 3
- 4421 Beach Dr E
- 4419 Beach Dr E
- 4415 Beach Dr E
- 4413 Beach Dr E
- 4461 Beach Dr E
- 4411 Beach Dr E
- 4475 Beach Dr E
- 4435 Waterman Ridge Ln E
- 4401 Beach Dr E
- 4459 Waterman Ridge Ln E
- 4395 Beach Dr E
- 4439 Waterman Ridge Ln E
- 4385 Beach Dr E