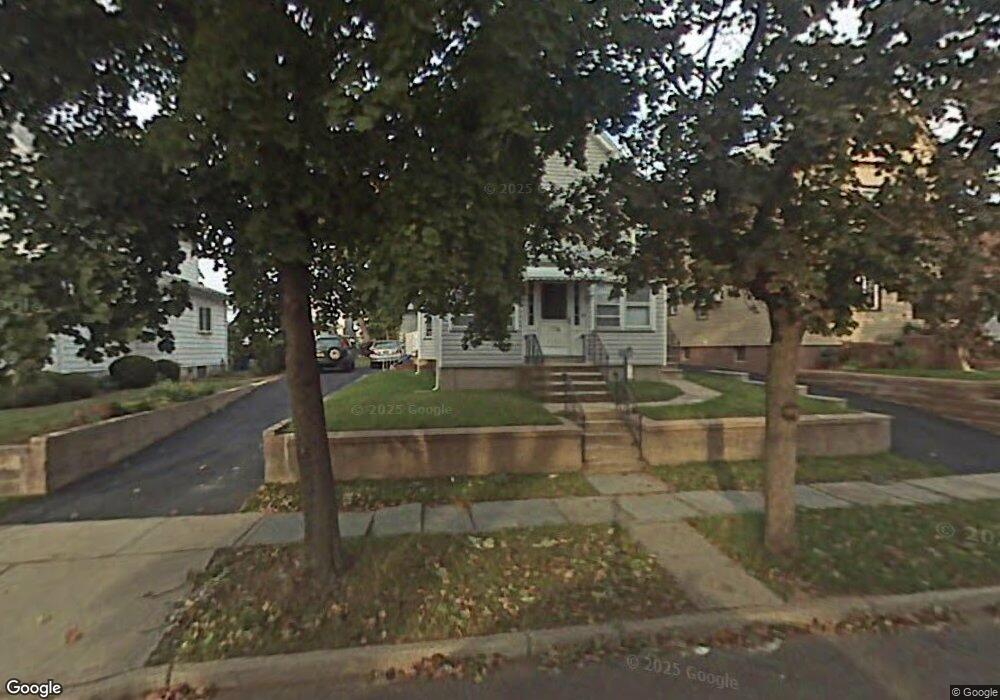
443 2nd Ave Unit 1 Lyndhurst, NJ 07071
Estimated Value: $576,000 - $652,000
1
Bed
2
Baths
1,766
Sq Ft
$352/Sq Ft
Est. Value
About This Home
This home is located at 443 2nd Ave Unit 1, Lyndhurst, NJ 07071 and is currently estimated at $621,216, approximately $351 per square foot. 443 2nd Ave Unit 1 is a home located in Bergen County with nearby schools including Lyndhurst High School and Sacred Heart School.
Ownership History
Date
Name
Owned For
Owner Type
Purchase Details
Closed on
Oct 19, 2020
Sold by
Lyons Timothy and Jannicelli Lisa
Bought by
Lyons Timothy and Lyons Lisa Jannicelli
Current Estimated Value
Home Financials for this Owner
Home Financials are based on the most recent Mortgage that was taken out on this home.
Original Mortgage
$375,000
Interest Rate
2.6%
Mortgage Type
New Conventional
Purchase Details
Closed on
Apr 9, 2015
Sold by
Giordano Ralph S and Giordano Cheryl
Bought by
Lyons Timothy and Jannicelli Lisa
Home Financials for this Owner
Home Financials are based on the most recent Mortgage that was taken out on this home.
Original Mortgage
$319,113
Interest Rate
3.87%
Mortgage Type
FHA
Purchase Details
Closed on
Apr 28, 2012
Sold by
Burkhalter
Bought by
Giordano Ralph S and Giordano Cheryl
Create a Home Valuation Report for This Property
The Home Valuation Report is an in-depth analysis detailing your home's value as well as a comparison with similar homes in the area
Home Values in the Area
Average Home Value in this Area
Purchase History
| Date | Buyer | Sale Price | Title Company |
|---|---|---|---|
| Lyons Timothy | -- | Commonwealth Land Ttl Ins Co | |
| Lyons Timothy | -- | None Listed On Document | |
| Lyons Timothy | $325,000 | None Available | |
| Giordano Ralph S | -- | -- | |
| Giordano Ralph S | -- | -- |
Source: Public Records
Mortgage History
| Date | Status | Borrower | Loan Amount |
|---|---|---|---|
| Previous Owner | Lyons Timothy | $375,000 | |
| Previous Owner | Lyons Timothy | $319,113 |
Source: Public Records
Tax History Compared to Growth
Tax History
| Year | Tax Paid | Tax Assessment Tax Assessment Total Assessment is a certain percentage of the fair market value that is determined by local assessors to be the total taxable value of land and additions on the property. | Land | Improvement |
|---|---|---|---|---|
| 2025 | $10,372 | $503,100 | $246,700 | $256,400 |
| 2024 | $10,004 | $497,200 | $243,700 | $253,500 |
| 2023 | $9,024 | $492,300 | $241,700 | $250,600 |
| 2022 | $9,024 | $284,500 | $163,000 | $121,500 |
| 2021 | $8,649 | $284,500 | $163,000 | $121,500 |
| 2020 | $8,461 | $284,500 | $163,000 | $121,500 |
| 2019 | $8,398 | $284,500 | $163,000 | $121,500 |
| 2018 | $8,467 | $284,500 | $163,000 | $121,500 |
| 2017 | $8,253 | $284,500 | $163,000 | $121,500 |
| 2016 | $8,068 | $284,500 | $163,000 | $121,500 |
| 2015 | $7,815 | $284,500 | $163,000 | $121,500 |
| 2014 | $7,713 | $284,500 | $163,000 | $121,500 |
Source: Public Records
Map
Nearby Homes
- 419 Lake Ave
- 482 6th Ave
- 561 New York Ave
- 545 Lake Ave
- 571 New York Ave
- 54 Stuyvesant Ave
- 232 Stuyvesant Ave
- 611 New York Ave
- 65 E Gouverneur Ave
- 252 Oriental Place
- 325 Valley Brook Ave
- 640 New York Ave
- 271 Travers Place
- 59 Kearney St
- 549-1-551 Laurel Ave
- 118 Rutherford Ave
- 725 2nd Ave
- 11 W Gouverneur Ave
- 220 Webster Ave