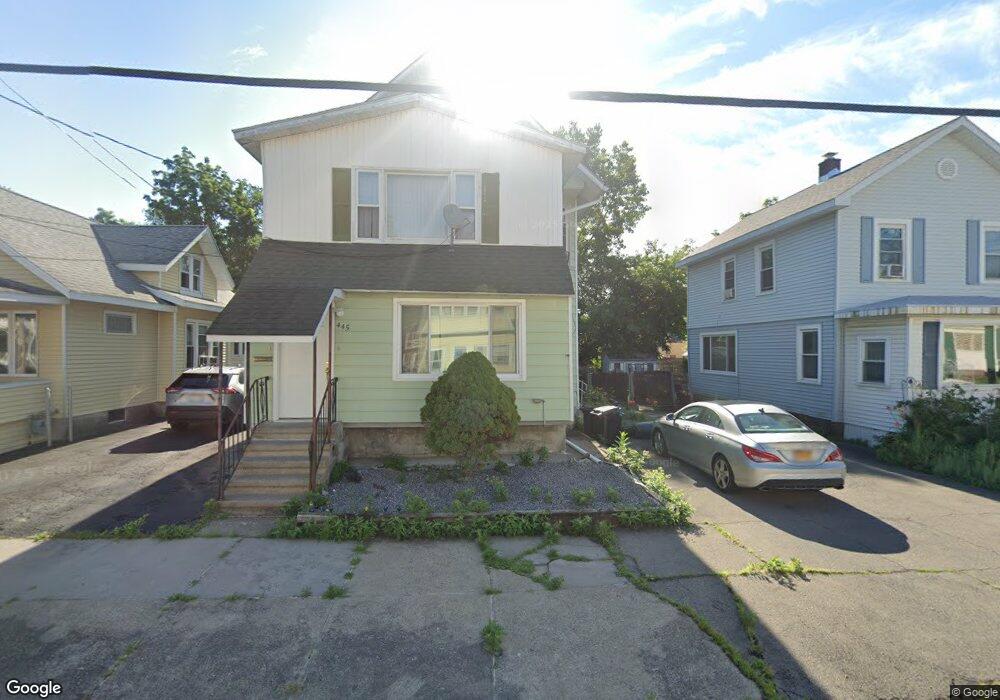
443 3rd St Schenectady, NY 12306
Bellevue NeighborhoodEstimated Value: $186,000 - $242,000
5
Beds
2
Baths
2,696
Sq Ft
$81/Sq Ft
Est. Value
About This Home
This home is located at 443 3rd St, Schenectady, NY 12306 and is currently estimated at $219,155, approximately $81 per square foot. 443 3rd St is a home located in Schenectady County with nearby schools including Van Corlaer Elementary School, Mont Pleasant Middle School, and Schenectady High School.
Ownership History
Date
Name
Owned For
Owner Type
Purchase Details
Closed on
Jan 6, 2023
Sold by
Mansion Michael P
Bought by
Sukhram Premnauth and Nationsbanc Mortgage Corporation
Current Estimated Value
Purchase Details
Closed on
Apr 25, 2011
Sold by
Ahmad A Ejaz and Ejaz Bushra
Bought by
James Delaurence
Home Financials for this Owner
Home Financials are based on the most recent Mortgage that was taken out on this home.
Original Mortgage
$150,193
Interest Rate
4.87%
Mortgage Type
FHA
Purchase Details
Closed on
Nov 10, 2005
Sold by
Shivbaran Rabindranauth
Bought by
Ahmad Ejaz
Home Financials for this Owner
Home Financials are based on the most recent Mortgage that was taken out on this home.
Original Mortgage
$97,500
Interest Rate
6.06%
Mortgage Type
New Conventional
Purchase Details
Closed on
May 22, 2002
Sold by
Cote Harold
Bought by
Shirbaran Rabin Drancuth Seeta P
Create a Home Valuation Report for This Property
The Home Valuation Report is an in-depth analysis detailing your home's value as well as a comparison with similar homes in the area
Home Values in the Area
Average Home Value in this Area
Purchase History
| Date | Buyer | Sale Price | Title Company |
|---|---|---|---|
| Sukhram Premnauth | $87,967 | -- | |
| James Delaurence | $154,500 | None Available | |
| Ahmad Ejaz | $130,000 | Tatha Jardanais | |
| Shirbaran Rabin Drancuth Seeta P | $87,000 | -- |
Source: Public Records
Mortgage History
| Date | Status | Borrower | Loan Amount |
|---|---|---|---|
| Previous Owner | James Delaurence | $150,193 | |
| Previous Owner | Ahmad Ejaz | $97,500 |
Source: Public Records
Tax History
| Year | Tax Paid | Tax Assessment Tax Assessment Total Assessment is a certain percentage of the fair market value that is determined by local assessors to be the total taxable value of land and additions on the property. | Land | Improvement |
|---|---|---|---|---|
| 2024 | $7,069 | $128,400 | $19,300 | $109,100 |
| 2023 | $73 | $128,400 | $19,300 | $109,100 |
| 2022 | $5,795 | $128,400 | $19,300 | $109,100 |
| 2021 | $5,695 | $128,400 | $19,300 | $109,100 |
| 2020 | $5,557 | $128,400 | $19,300 | $109,100 |
| 2019 | $3,550 | $128,400 | $19,300 | $109,100 |
| 2018 | $5,553 | $128,400 | $19,300 | $109,100 |
| 2017 | $4,934 | $128,400 | $19,300 | $109,100 |
| 2016 | $5,752 | $128,400 | $19,300 | $109,100 |
| 2015 | -- | $128,400 | $19,300 | $109,100 |
| 2014 | -- | $128,400 | $19,300 | $109,100 |
Source: Public Records
Map
Nearby Homes
- 1679 Broadway
- 1821 Broadway
- 1913 Euclid Ave
- 1915 Campbell Ave
- 1617 Campbell Ave
- 817 Genesee St
- 2026 Euclid Ave
- 417 Cora St
- 918 Hegeman St
- 1617 4th Ave
- 467 Cedar St
- L30 Broadway
- 729 Cutler St
- 1002 Davis Terrace
- 660 Sunset St
- 2220-2222 Campbell Ave
- 408 Shannon St
- 577 Ontario St
- 1320 4th Ave
- 2328 Turner Ave
Your Personal Tour Guide
Ask me questions while you tour the home.