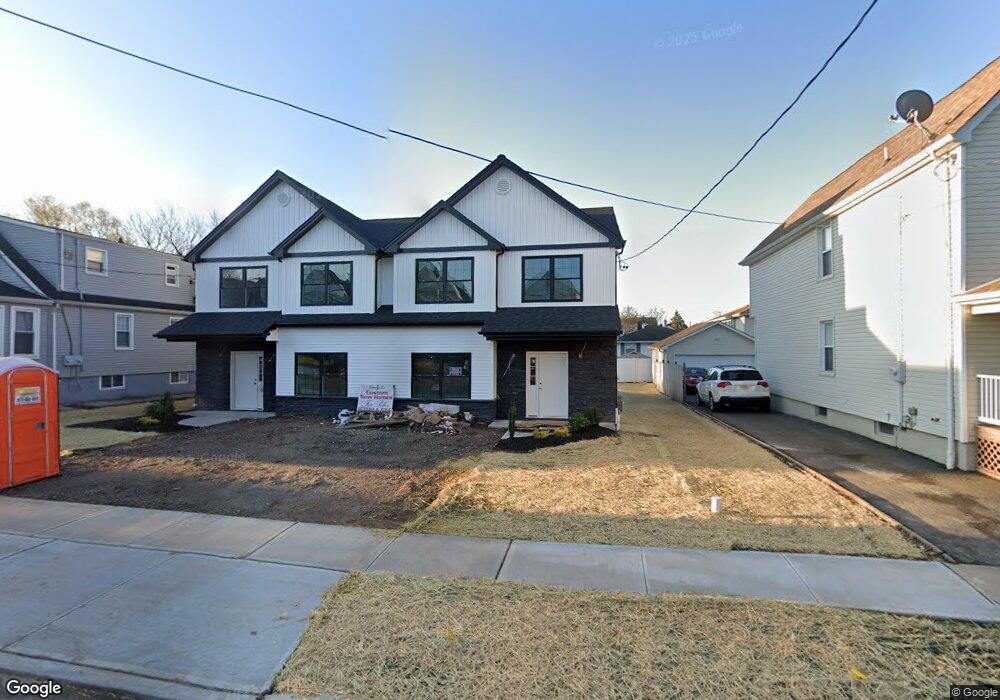
443 Ainsworth St Linden, NJ 07036
Estimated Value: $514,602 - $643,000
--
Bed
--
Bath
924
Sq Ft
$626/Sq Ft
Est. Value
About This Home
This home is located at 443 Ainsworth St, Linden, NJ 07036 and is currently estimated at $578,801, approximately $626 per square foot. 443 Ainsworth St is a home located in Union County with nearby schools including School No. 8, Myles J. McManus Middle School, and Linden High School.
Ownership History
Date
Name
Owned For
Owner Type
Purchase Details
Closed on
Jul 25, 2025
Sold by
Domenico P Lettini Living Trust and Lettini & Son Inc
Bought by
Gross Menachem and Brauner Chaya
Current Estimated Value
Home Financials for this Owner
Home Financials are based on the most recent Mortgage that was taken out on this home.
Original Mortgage
$548,000
Outstanding Balance
$546,119
Interest Rate
6.81%
Mortgage Type
New Conventional
Estimated Equity
$32,682
Purchase Details
Closed on
Dec 29, 2023
Sold by
Lettini & Son Inc
Bought by
Lettini & Son Inc
Purchase Details
Closed on
Feb 23, 2023
Sold by
Agostaro Tony
Bought by
Lettini & Sons Inc
Purchase Details
Closed on
Mar 10, 2014
Sold by
Agostaro Francesca and Agostaro Tony
Bought by
Agostard Tony
Create a Home Valuation Report for This Property
The Home Valuation Report is an in-depth analysis detailing your home's value as well as a comparison with similar homes in the area
Home Values in the Area
Average Home Value in this Area
Purchase History
| Date | Buyer | Sale Price | Title Company |
|---|---|---|---|
| Gross Menachem | $722,400 | Thalwei Abstract | |
| Gross Menachem | $722,400 | Thalwei Abstract | |
| Lettini & Son Inc | -- | None Listed On Document | |
| Lettini & Sons Inc | $440,000 | Stewart Title | |
| Lettini & Sons Inc | $440,000 | Stewart Title | |
| Agostard Tony | -- | None Available |
Source: Public Records
Mortgage History
| Date | Status | Borrower | Loan Amount |
|---|---|---|---|
| Open | Gross Menachem | $548,000 | |
| Closed | Gross Menachem | $548,000 |
Source: Public Records
Tax History Compared to Growth
Tax History
| Year | Tax Paid | Tax Assessment Tax Assessment Total Assessment is a certain percentage of the fair market value that is determined by local assessors to be the total taxable value of land and additions on the property. | Land | Improvement |
|---|---|---|---|---|
| 2025 | $4,859 | $69,100 | $69,100 | -- |
| 2024 | $9,801 | $69,100 | $69,100 | $0 |
| 2023 | $9,801 | $142,500 | $69,100 | $73,400 |
| 2022 | $9,852 | $142,500 | $69,100 | $73,400 |
| 2021 | $9,902 | $142,500 | $69,100 | $73,400 |
| 2020 | $9,850 | $142,500 | $69,100 | $73,400 |
| 2019 | $9,817 | $142,500 | $69,100 | $73,400 |
| 2018 | $9,814 | $142,500 | $69,100 | $73,400 |
| 2017 | $9,602 | $142,500 | $69,100 | $73,400 |
| 2016 | $9,300 | $142,500 | $69,100 | $73,400 |
| 2015 | $8,945 | $142,500 | $69,100 | $73,400 |
| 2014 | $8,771 | $142,500 | $69,100 | $73,400 |
Source: Public Records
Map
Nearby Homes
- 428 Brook St
- 435 Miner Terrace
- 505 Knopf St
- 419 Lafayette St
- 30 E Henry St
- 606 Knopf St
- 600 W Henry St
- 721 N Wood Ave
- 725 N Wood Ave
- 420 Miltonia St
- 324 Dewitt St
- 717 Summit St
- 106 W Gibbons St
- 28 W Elizabeth Ave Unit A3
- 201 Hussa St
- 349 Miltonia St
- 813 N Wood Ave
- 10 N Wood Ave Unit 706
- 10 N Wood Ave Unit 312
- 10 N Wood Ave Unit 700
- 445 Ainsworth St
- 433 Ainsworth St
- 449 Ainsworth St
- 429 Ainsworth St
- 440 Brook St
- 436 Brook St
- 444 Brook St
- 434 Brook St
- 448 Brook St
- 425 Ainsworth St
- 428 Brook St Unit 2
- 440 Ainsworth St
- 436 Ainsworth St
- 442 Ainsworth St
- 432 Ainsworth St
- 448 Ainsworth St
- 501 Ainsworth St
- 424 Brook St
- 419 Ainsworth St
- 426 Ainsworth St