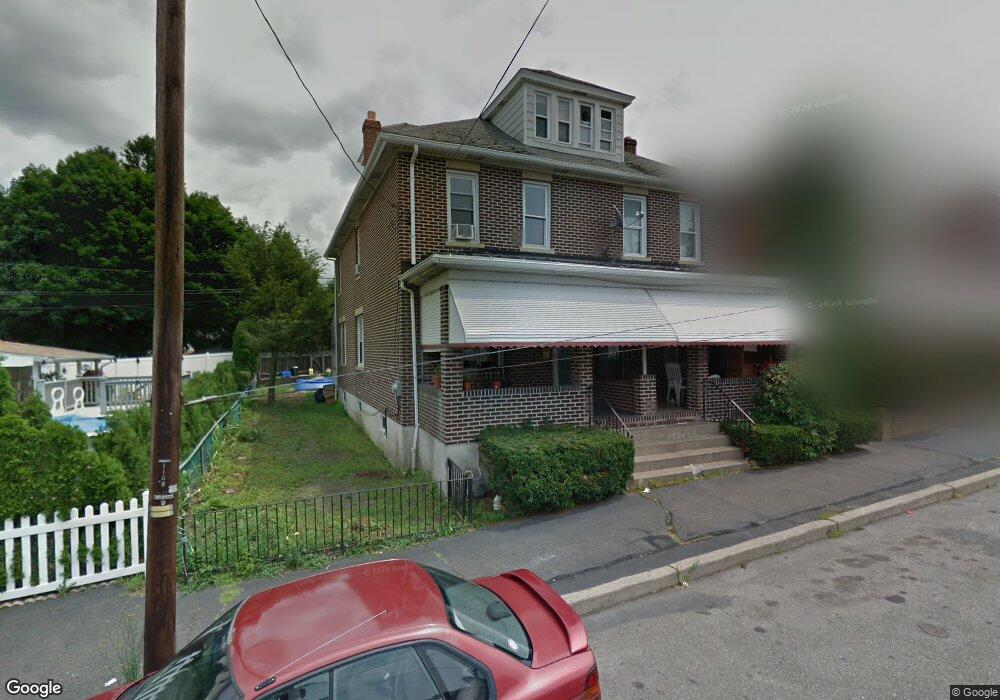
443 Allen St West Hazleton, PA 18202
Estimated Value: $160,622 - $195,000
--
Bed
--
Bath
1,776
Sq Ft
$99/Sq Ft
Est. Value
About This Home
This home is located at 443 Allen St, West Hazleton, PA 18202 and is currently estimated at $175,406, approximately $98 per square foot. 443 Allen St is a home located in Luzerne County with nearby schools including Hazleton Area High School, Immanuel Christian School, and Bishop Hafey Junior/Senior High School.
Ownership History
Date
Name
Owned For
Owner Type
Purchase Details
Closed on
Jan 9, 2014
Sold by
Sanchez Julio C
Bought by
Pujois Angel A
Current Estimated Value
Purchase Details
Closed on
Sep 19, 2013
Sold by
Sanchez Julio C
Bought by
Pujois Angel
Purchase Details
Closed on
Mar 7, 2006
Sold by
Geisick Ruth H and Geisick Barbara A
Bought by
Sanchez Julio C
Home Financials for this Owner
Home Financials are based on the most recent Mortgage that was taken out on this home.
Original Mortgage
$62,964
Interest Rate
8.44%
Mortgage Type
Adjustable Rate Mortgage/ARM
Create a Home Valuation Report for This Property
The Home Valuation Report is an in-depth analysis detailing your home's value as well as a comparison with similar homes in the area
Home Values in the Area
Average Home Value in this Area
Purchase History
| Date | Buyer | Sale Price | Title Company |
|---|---|---|---|
| Pujois Angel A | $6,827 | None Available | |
| Pujois Angel | $6,827 | None Available | |
| Sanchez Julio C | $69,460 | None Available |
Source: Public Records
Mortgage History
| Date | Status | Borrower | Loan Amount |
|---|---|---|---|
| Previous Owner | Sanchez Julio C | $62,964 |
Source: Public Records
Tax History Compared to Growth
Tax History
| Year | Tax Paid | Tax Assessment Tax Assessment Total Assessment is a certain percentage of the fair market value that is determined by local assessors to be the total taxable value of land and additions on the property. | Land | Improvement |
|---|---|---|---|---|
| 2025 | $2,038 | $80,800 | $19,800 | $61,000 |
| 2024 | $1,971 | $80,800 | $19,800 | $61,000 |
| 2023 | $1,920 | $80,800 | $19,800 | $61,000 |
| 2022 | $1,905 | $80,800 | $19,800 | $61,000 |
| 2021 | $1,858 | $80,800 | $19,800 | $61,000 |
| 2020 | $1,832 | $80,800 | $19,800 | $61,000 |
| 2019 | $1,690 | $80,800 | $19,800 | $61,000 |
| 2018 | $1,637 | $80,800 | $19,800 | $61,000 |
| 2017 | $1,608 | $80,800 | $19,800 | $61,000 |
| 2016 | -- | $80,800 | $19,800 | $61,000 |
| 2015 | $945 | $80,800 | $19,800 | $61,000 |
| 2014 | $945 | $80,800 | $19,800 | $61,000 |
Source: Public Records
Map
Nearby Homes
- 60 E Jefferson Ave
- 667 Roosevelt St
- 124 Putnam St
- 609 Landmesser Ave
- 9 Park St
- 590 Mckinley St
- 118 E Green St
- 31 Park St
- 307 W Green St
- 111 S Broad St
- 756 Peace St
- 328 W Green St
- 1 W Diamond Ave
- 329 Ridge Ave
- 782 N James St
- 536 W Green St
- 1009 Peace St
- 0 Pennsylvania 93
- 882 N Locust St
- 522 N James St