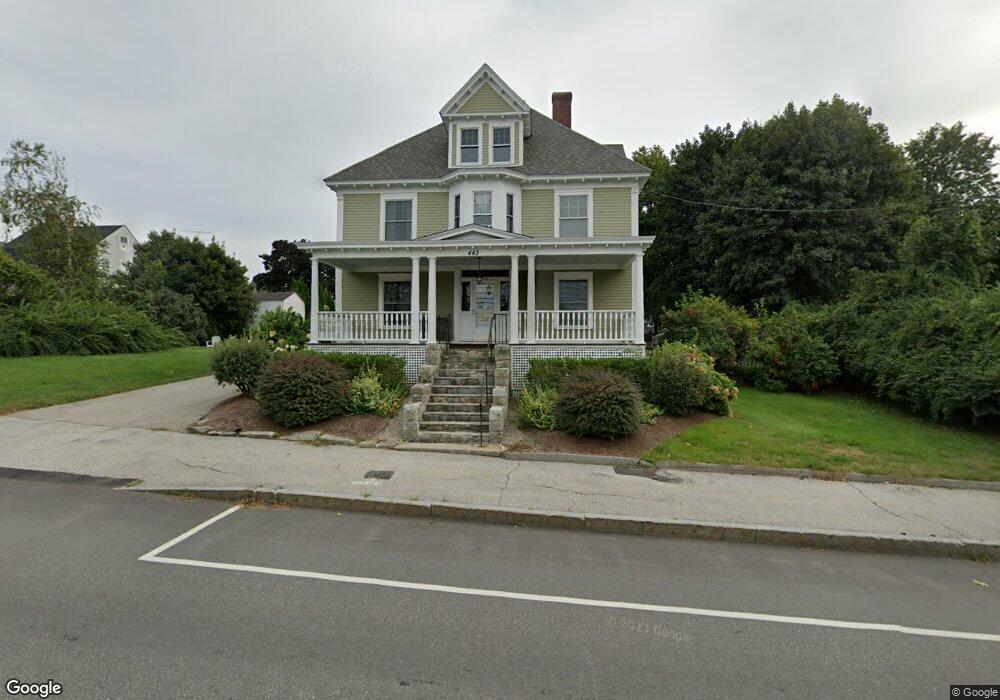
443 Bridge St Manchester, NH 03104
Hanover Hill NeighborhoodEstimated Value: $527,000 - $655,353
About This Home
This home is located at 443 Bridge St, Manchester, NH 03104 and is currently estimated at $595,088, approximately $211 per square foot. 443 Bridge St is a home located in Hillsborough County with nearby schools including McDonough Elementary School, Hillside Middle School, and Manchester Central High School.
Ownership History
We collect this data history from publicly available records. To have your information removed, we recommend requesting removal directly through your county’s website.
Purchase Details
Home Financials for this Owner
Home Financials are based on the most recent Mortgage that was taken out on this home.Home Values in the Area
Average Home Value in this Area
Purchase History
We collect this data history from publicly available records. To have your information removed, we recommend requesting removal directly through your county’s website.
| Date | Buyer | Sale Price | Title Company |
|---|---|---|---|
| $225,000 | -- |
Mortgage History
We collect this data history from publicly available records. To have your information removed, we recommend requesting removal directly through your county’s website.
| Date | Status | Borrower | Loan Amount |
|---|---|---|---|
| Open | $244,000 | ||
| Closed | $250,000 | ||
| Closed | $213,750 |
Tax History
We collect this data history from publicly available records. To have your information removed, we recommend requesting removal directly through your county’s website.
| Year | Tax Paid | Tax Assessment Tax Assessment Total Assessment is a certain percentage of the fair market value that is determined by local assessors to be the total taxable value of land and additions on the property. | Land | Improvement |
|---|---|---|---|---|
| 2024 | $10,227 | $522,300 | $99,900 | $422,400 |
| 2023 | $9,851 | $522,300 | $99,900 | $422,400 |
| 2022 | $9,527 | $522,300 | $99,900 | $422,400 |
| 2021 | $9,234 | $522,300 | $99,900 | $422,400 |
| 2020 | $9,302 | $377,200 | $72,500 | $304,700 |
| 2019 | $7,068 | $377,200 | $72,500 | $304,700 |
| 2018 | $8,932 | $377,200 | $72,500 | $304,700 |
| 2017 | $8,500 | $377,200 | $72,500 | $304,700 |
| 2016 | $8,728 | $377,200 | $72,500 | $304,700 |
| 2015 | $8,136 | $347,100 | $72,500 | $274,600 |
| 2014 | $8,157 | $347,100 | $72,500 | $274,600 |
| 2013 | $7,869 | $347,100 | $72,500 | $274,600 |
Map
- 406 E High St
- 37 - 39 Mead St
- 874 Belmont St
- 33 High Ridge Rd
- 426 Manchester St
- 421 Laurel St
- 412 Manchester St
- 41 Bruce Rd
- 518 Central St
- 494 Laurel St
- 493 Laurel St
- 270 Orange St Unit 2
- 383 Manchester St
- 143 High Ridge Rd
- 516 Lake Ave
- 171 Kenney St
- 171 High Ridge Rd
- 479 Lake Ave
- 271 Merritt Nyberg Ln
- 108 Peak St
- 458 E High St
- 468 E High St
- 450 E High St
- 473 E High St
- 699 Beacon St
- 435 Bridge St
- 707 Beacon St
- 472 E High St
- 465 E High St Unit 1
- 465 E High St Unit 3
- 465 E High St Unit 2
- 114 Weston St
- 461 E High St
- 467 E High St
- 457 E High St
- 719 Beacon St
- 122 Weston St
- 671 Beacon St
- 476 E High St
- 686 Beacon St
Ask me questions while you tour the home.