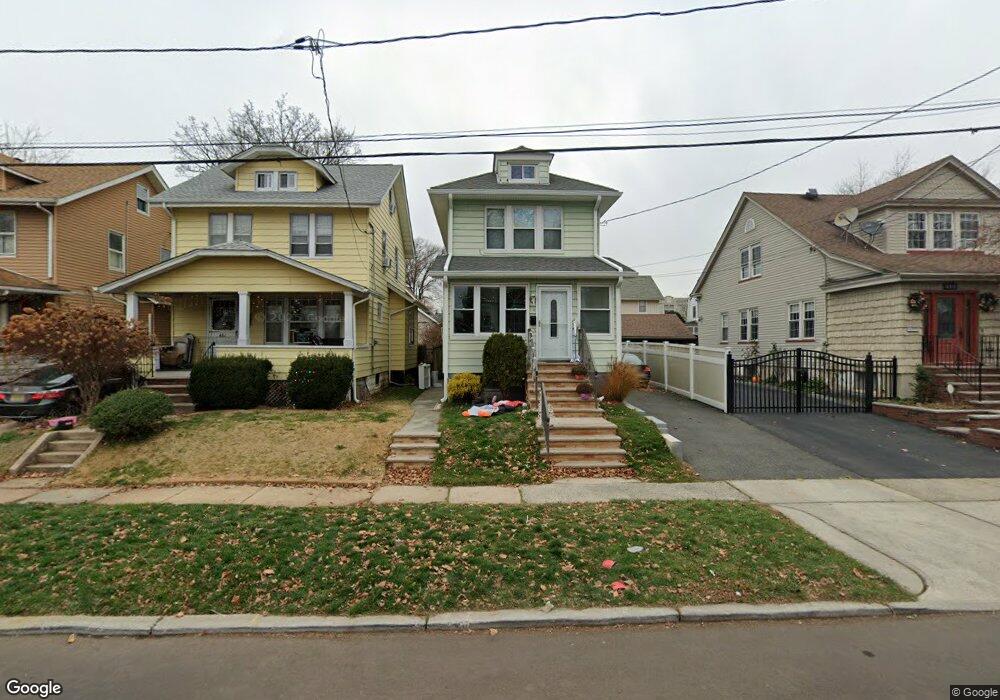
443 E 4th Ave Roselle, NJ 07203
Estimated Value: $432,000 - $503,000
Studio
--
Bath
1,261
Sq Ft
$361/Sq Ft
Est. Value
About This Home
This home is located at 443 E 4th Ave, Roselle, NJ 07203 and is currently estimated at $455,829, approximately $361 per square foot. 443 E 4th Ave is a home located in Union County with nearby schools including Harrison Elementary School, Leonard V. Moore Middle School, and Grace Wilday Junior High School.
Ownership History
Date
Name
Owned For
Owner Type
Purchase Details
Closed on
Jul 13, 2009
Sold by
Garcia Jose and Garcia Faiza
Bought by
Simpson Shavonne
Current Estimated Value
Home Financials for this Owner
Home Financials are based on the most recent Mortgage that was taken out on this home.
Original Mortgage
$140,000
Outstanding Balance
$91,373
Interest Rate
5.31%
Mortgage Type
Purchase Money Mortgage
Estimated Equity
$364,456
Create a Home Valuation Report for This Property
The Home Valuation Report is an in-depth analysis detailing your home's value as well as a comparison with similar homes in the area
Home Values in the Area
Average Home Value in this Area
Purchase History
| Date | Buyer | Sale Price | Title Company |
|---|---|---|---|
| Simpson Shavonne | $175,000 | Old Republic National Title |
Source: Public Records
Mortgage History
| Date | Status | Borrower | Loan Amount |
|---|---|---|---|
| Open | Simpson Shavonne | $140,000 |
Source: Public Records
Tax History
| Year | Tax Paid | Tax Assessment Tax Assessment Total Assessment is a certain percentage of the fair market value that is determined by local assessors to be the total taxable value of land and additions on the property. | Land | Improvement |
|---|---|---|---|---|
| 2025 | $8,373 | $96,300 | $52,000 | $44,300 |
| 2024 | $8,163 | $96,300 | $52,000 | $44,300 |
| 2023 | $8,163 | $96,300 | $52,000 | $44,300 |
| 2022 | $8,220 | $96,300 | $52,000 | $44,300 |
| 2021 | $8,171 | $96,300 | $52,000 | $44,300 |
| 2020 | $8,145 | $96,300 | $52,000 | $44,300 |
| 2019 | $8,041 | $96,300 | $52,000 | $44,300 |
| 2018 | $7,997 | $96,300 | $52,000 | $44,300 |
| 2017 | $7,954 | $96,300 | $52,000 | $44,300 |
| 2016 | $7,779 | $96,300 | $52,000 | $44,300 |
| 2015 | $7,778 | $96,300 | $52,000 | $44,300 |
| 2014 | $7,561 | $96,300 | $52,000 | $44,300 |
Source: Public Records
Map
Nearby Homes
- 424 E 4th Ave
- 502 Drake Ave
- 317 Drake Ave
- 415 E 3rd Ave Unit 3
- 540 E 3rd Ave
- 549 E 3rd Ave
- 310 Stockton Ave
- 721 Sheridan Ave
- 247 E 7th Ave
- 703 Elm St
- 717 Galvin Ave
- 761 Drake Ave
- 255 E Westfield Ave
- 117 Pershing Ave
- 410 Morris Place
- 221 E Westfield Ave
- 238 E 8th Ave
- 415 E 10th Ave
- 455 E Westfield Ave
- 226 E 8th Ave
Your Personal Tour Guide
Ask me questions while you tour the home.