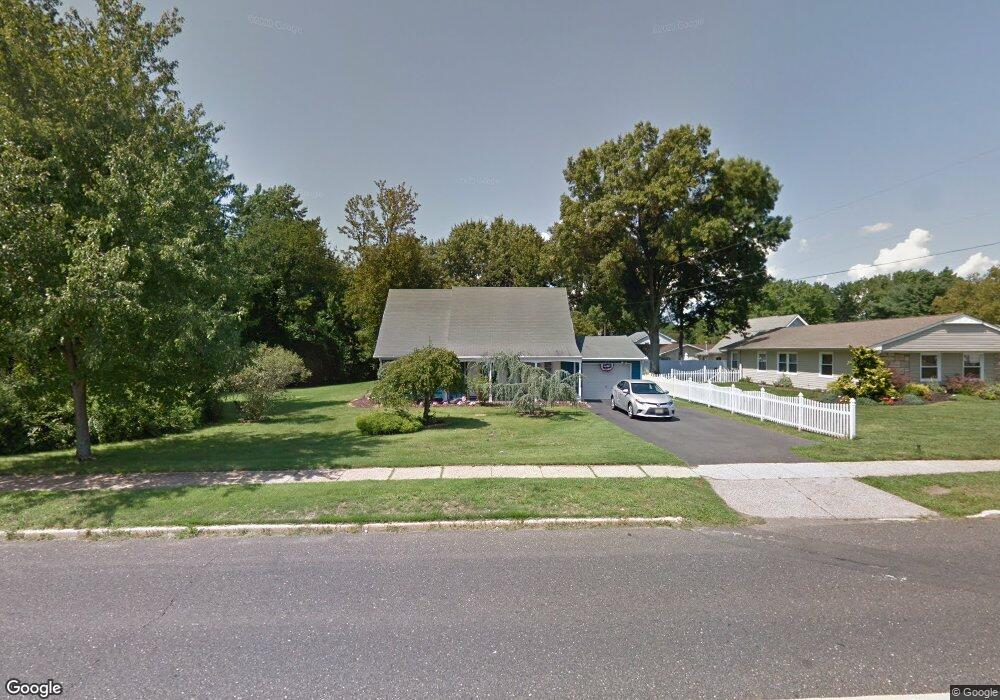
443 Lloyd Rd Matawan, NJ 07747
Estimated Value: $632,000 - $699,000
4
Beds
2
Baths
1,569
Sq Ft
$421/Sq Ft
Est. Value
About This Home
This home is located at 443 Lloyd Rd, Matawan, NJ 07747 and is currently estimated at $660,867, approximately $421 per square foot. 443 Lloyd Rd is a home located in Monmouth County with nearby schools including Matawan Reg High School, St Benedict School, and St. Joseph Elementary School.
Ownership History
Date
Name
Owned For
Owner Type
Purchase Details
Closed on
Sep 10, 2013
Sold by
Mak Johnny and Mak Lorraine Perlow
Bought by
Perlow Lorraine
Current Estimated Value
Purchase Details
Closed on
Jul 8, 1994
Sold by
Gee Meredith
Bought by
Mak Johnny and Mak Lorraine
Home Financials for this Owner
Home Financials are based on the most recent Mortgage that was taken out on this home.
Original Mortgage
$115,000
Interest Rate
8.51%
Create a Home Valuation Report for This Property
The Home Valuation Report is an in-depth analysis detailing your home's value as well as a comparison with similar homes in the area
Home Values in the Area
Average Home Value in this Area
Purchase History
| Date | Buyer | Sale Price | Title Company |
|---|---|---|---|
| Perlow Lorraine | -- | None Available | |
| Mak Johnny | $144,000 | -- |
Source: Public Records
Mortgage History
| Date | Status | Borrower | Loan Amount |
|---|---|---|---|
| Previous Owner | Mak Johnny | $115,000 |
Source: Public Records
Tax History
| Year | Tax Paid | Tax Assessment Tax Assessment Total Assessment is a certain percentage of the fair market value that is determined by local assessors to be the total taxable value of land and additions on the property. | Land | Improvement |
|---|---|---|---|---|
| 2025 | $10,113 | $564,500 | $427,500 | $137,000 |
| 2024 | $9,703 | $500,400 | $365,900 | $134,500 |
| 2023 | $9,703 | $453,600 | $322,200 | $131,400 |
| 2022 | $9,379 | $382,000 | $258,800 | $123,200 |
| 2021 | $9,379 | $347,000 | $237,400 | $109,600 |
| 2020 | $9,594 | $353,500 | $246,400 | $107,100 |
| 2019 | $9,508 | $340,300 | $233,800 | $106,500 |
| 2018 | $9,130 | $327,600 | $226,100 | $101,500 |
| 2017 | $8,728 | $317,600 | $208,100 | $109,500 |
| 2016 | $8,147 | $309,400 | $202,700 | $106,700 |
| 2015 | $8,586 | $313,000 | $200,900 | $112,100 |
| 2014 | $8,420 | $313,000 | $200,900 | $112,100 |
Source: Public Records
Map
Nearby Homes
- 110 Courtland Ln
- 537 S Atlantic Ave
- 5 Limerick Place
- 11 Anton Place
- 20 Galway Dr
- 33 Balmoral Ct Unit 33
- 114 Dundee Ct
- 16 Galway Dr
- 3 Noble Place
- 99 Idlebrook Ln
- 244 Lloyd Rd
- 9 Amherst Ct
- 72 Idlebrook Ln
- 182 Edinburgh Ct
- 414 Sloan Ct
- 323 Arlene Terrace
- 315 Wellington Place
- 326 Sloan Ct Unit 326
- 49 Lucia Ct
- 41 Faith Ln
Your Personal Tour Guide
Ask me questions while you tour the home.