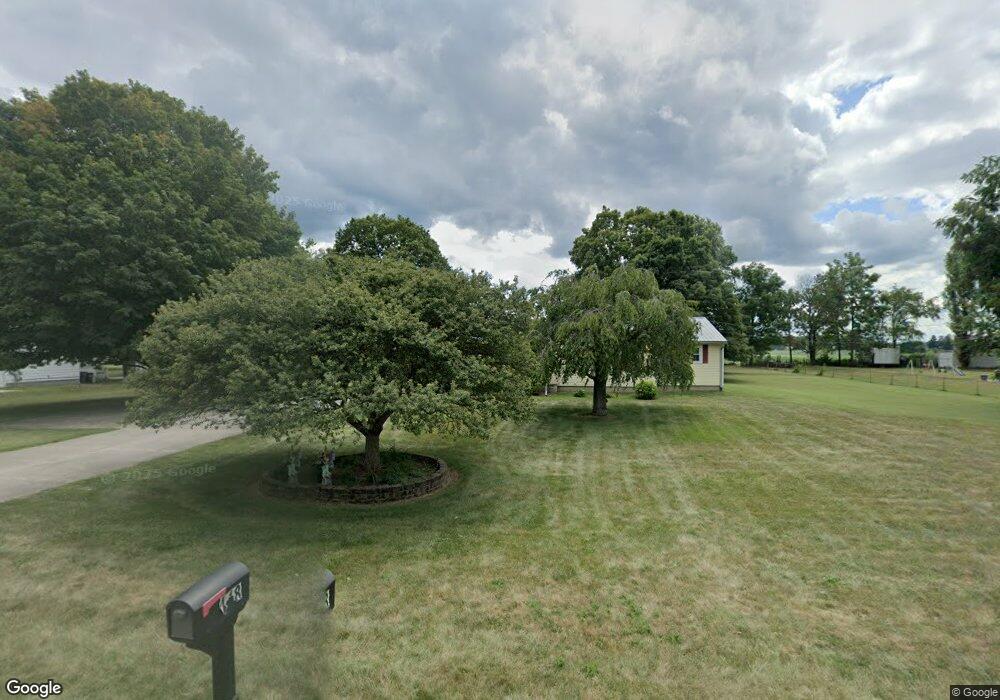
443 Marion Cardington Rd E Marion, OH 43302
Estimated Value: $271,000 - $331,000
3
Beds
2
Baths
1,648
Sq Ft
$182/Sq Ft
Est. Value
About This Home
This home is located at 443 Marion Cardington Rd E, Marion, OH 43302 and is currently estimated at $299,721, approximately $181 per square foot. 443 Marion Cardington Rd E is a home located in Marion County with nearby schools including Pleasant Elementary School, Pleasant Middle School, and Pleasant High School.
Ownership History
Date
Name
Owned For
Owner Type
Purchase Details
Closed on
Aug 9, 2022
Sold by
Stanford William C and Stanford Julia R
Bought by
Stanford Family Trust
Current Estimated Value
Purchase Details
Closed on
Jun 29, 2022
Sold by
Stanford Rodney D and Stanford Betty I
Bought by
Stanford William C and Stanford Rodney D
Purchase Details
Closed on
Aug 13, 2020
Sold by
Stanford Rodney D
Bought by
Stanford Rodney D and Stanford Betty I
Purchase Details
Closed on
Dec 11, 2013
Sold by
Stanford Rodney D and Stanford Betty L
Bought by
Stanford Rodney D
Purchase Details
Closed on
Sep 23, 2009
Sold by
Page Jeremy M and Page Randall J
Bought by
Stanford Rodney D and Stanford Betty L
Purchase Details
Closed on
Feb 2, 2009
Sold by
Estate Of Tammy F Page
Bought by
Page Jeremy M and Page Randell J
Purchase Details
Closed on
Oct 19, 2006
Sold by
Eckert Amy J
Bought by
Page Tammy F
Purchase Details
Closed on
May 5, 2003
Bought by
Stanford Rodney D
Purchase Details
Closed on
May 4, 2001
Bought by
Stanford Rodney D
Create a Home Valuation Report for This Property
The Home Valuation Report is an in-depth analysis detailing your home's value as well as a comparison with similar homes in the area
Home Values in the Area
Average Home Value in this Area
Purchase History
| Date | Buyer | Sale Price | Title Company |
|---|---|---|---|
| Stanford Family Trust | $160,500 | Osborne Wesley W | |
| Stanford Family Trust | $160,500 | None Listed On Document | |
| Stanford William C | -- | Osborne Wesley W | |
| Stanford Rodney D | -- | None Available | |
| Stanford Rodney D | -- | None Available | |
| Stanford Rodney D | $120,000 | Chicago Title | |
| Page Jeremy M | $159,601 | None Available | |
| Page Tammy F | $152,000 | None Available | |
| Stanford Rodney D | -- | -- | |
| Stanford Rodney D | -- | -- |
Source: Public Records
Tax History Compared to Growth
Tax History
| Year | Tax Paid | Tax Assessment Tax Assessment Total Assessment is a certain percentage of the fair market value that is determined by local assessors to be the total taxable value of land and additions on the property. | Land | Improvement |
|---|---|---|---|---|
| 2024 | $3,086 | $74,560 | $11,610 | $62,950 |
| 2023 | $3,077 | $74,560 | $11,610 | $62,950 |
| 2022 | $2,670 | $74,560 | $11,610 | $62,950 |
| 2021 | $1,898 | $53,300 | $9,580 | $43,720 |
| 2020 | $2,275 | $53,300 | $9,580 | $43,720 |
| 2019 | $2,387 | $53,300 | $9,580 | $43,720 |
| 2018 | $1,655 | $49,020 | $8,330 | $40,690 |
| 2017 | $1,660 | $49,020 | $8,330 | $40,690 |
| 2016 | $1,656 | $49,020 | $8,330 | $40,690 |
| 2015 | $1,681 | $47,810 | $7,940 | $39,870 |
| 2014 | $1,682 | $47,810 | $7,940 | $39,870 |
| 2012 | $1,167 | $42,550 | $8,510 | $34,040 |
Source: Public Records
Map
Nearby Homes
- 550 Marion Cardington Rd E
- 0 E Marion Cardington Rd Unit 9052845
- 0 E Marion Cardington Rd Unit 221031760
- 1513 Center Park Dr
- 1545 Center Park Dr
- 1562 Center Park Dr
- 0 Republic Way Unit 225015738
- 1051 Thomas Dr
- 1480 Wellness Dr
- 1639 Marion-Waldo Rd Unit 1653
- 1639 Marion Waldo Rd Unit 113
- 692 Hampton Woods Dr
- 0 Marion-Waldo Rd Unit 224033985
- 4.5 Acres Marion-Waldo Rd
- 1716 Marion-Waldo Rd
- 519 Gemini Dr
- 3068 Marion-Waldo Rd Unit 73
- 880 Loire Valley Dr
- Tract 1-6 Southland Pkwy
- 1290 Old Pond Dr
- 463 Marion Cardington Rd E
- 421 Marion Cardington Rd E
- 448 Marion Cardington Rd E
- 483 Marion Cardington Rd E
- 428 Marion Cardington Rd E
- 428 Marion-Cardington Rd E
- 470 Marion Cardington Rd E
- 393 Marion Cardington Rd E
- 396 Marion Cardington Rd E
- 490 Marion Cardington Rd E
- 505 Marion Cardington Rd E
- 380 Marion Cardington Rd E
- 510 Marion Cardington Rd E
- 533 Marion Cardington Rd E
- 530 Marion Cardington Rd E
- 561 Marion Cardington Rd E
- 0 E Marion Cardington Rd Unit 2724591
- 0 E Marion Cardington Rd Unit 2724581
- 0 E Marion Cardington Rd Unit 9910514
- 0 E Marion Cardington Rd Unit 9025905