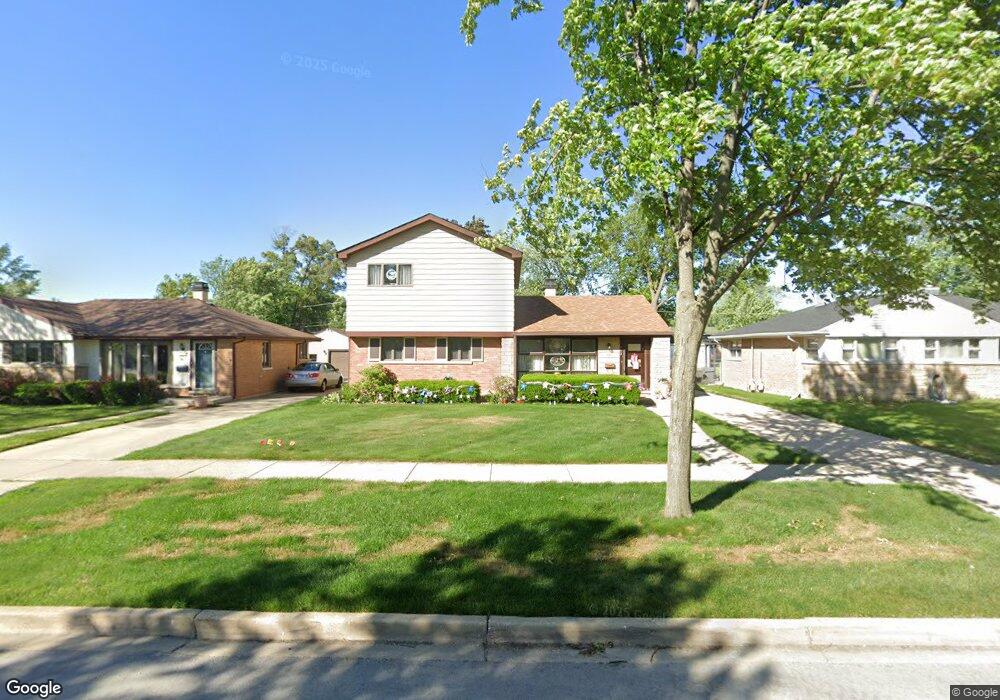
443 N Highview Ave Elmhurst, IL 60126
Estimated Value: $466,000 - $608,000
--
Bed
--
Bath
1,766
Sq Ft
$300/Sq Ft
Est. Value
About This Home
This home is located at 443 N Highview Ave, Elmhurst, IL 60126 and is currently estimated at $530,071, approximately $300 per square foot. 443 N Highview Ave is a home located in DuPage County with nearby schools including Emerson Elementary School, Churchville Middle School, and York Community High School.
Ownership History
Date
Name
Owned For
Owner Type
Purchase Details
Closed on
Jun 7, 1996
Sold by
Kauffman Lynn M
Bought by
Nolazco Diana
Current Estimated Value
Home Financials for this Owner
Home Financials are based on the most recent Mortgage that was taken out on this home.
Original Mortgage
$132,800
Outstanding Balance
$8,523
Interest Rate
8.05%
Estimated Equity
$521,548
Create a Home Valuation Report for This Property
The Home Valuation Report is an in-depth analysis detailing your home's value as well as a comparison with similar homes in the area
Home Values in the Area
Average Home Value in this Area
Purchase History
| Date | Buyer | Sale Price | Title Company |
|---|---|---|---|
| Nolazco Diana | $166,000 | -- |
Source: Public Records
Mortgage History
| Date | Status | Borrower | Loan Amount |
|---|---|---|---|
| Open | Nolazco Diana | $132,800 |
Source: Public Records
Tax History Compared to Growth
Tax History
| Year | Tax Paid | Tax Assessment Tax Assessment Total Assessment is a certain percentage of the fair market value that is determined by local assessors to be the total taxable value of land and additions on the property. | Land | Improvement |
|---|---|---|---|---|
| 2024 | $10,296 | $176,126 | $70,816 | $105,310 |
| 2023 | $9,499 | $161,910 | $65,100 | $96,810 |
| 2022 | $9,319 | $158,130 | $62,300 | $95,830 |
| 2021 | $8,922 | $151,460 | $59,670 | $91,790 |
| 2020 | $8,395 | $145,070 | $57,150 | $87,920 |
| 2019 | $8,311 | $139,490 | $54,950 | $84,540 |
| 2018 | $7,885 | $131,890 | $52,340 | $79,550 |
| 2017 | $7,732 | $126,050 | $50,020 | $76,030 |
| 2016 | $7,409 | $116,380 | $46,180 | $70,200 |
| 2015 | $7,265 | $107,510 | $42,660 | $64,850 |
| 2014 | $6,857 | $94,070 | $35,200 | $58,870 |
| 2013 | $6,828 | $95,990 | $35,920 | $60,070 |
Source: Public Records
Map
Nearby Homes
- 412 N Ridgeland Ave
- 468 N Highland Ave
- 442 N Oak St
- 322 N Highland Ave
- 407 W North Ave
- 285 N Ridgeland Ave
- 284 N Highland Ave
- 656 W Comstock Ave
- 655 W Comstock Ave
- 456 N Elm Ave
- 251 W Armitage Ave
- 314 N Elm Ave
- 196 N Walnut St
- 724 N Junior Terrace
- 901 E Krage Dr
- 902 E Krage Dr
- 193 N Elm Ave
- 120 N Walnut St
- 355 W 1st St
- 600 E Armitage Ave
- 435 N Highview Ave
- 451 N Highview Ave
- 450 N Ridgeland Ave
- 446 N Ridgeland Ave
- 444 N Ridgeland Ave
- 440 N Highview Ave
- 453 N Highview Ave
- 427 N Highview Ave
- 452 N Ridgeland Ave
- 446 N Highview Ave
- 450 N Highview Ave
- 457 N Highview Ave
- 423 N Highview Ave
- 436 N Highview Ave
- 424 N Highview Ave
- 452 N Highview Ave
- 454 N Ridgeland Ave
- 454 N Highview Ave
- 459 N Highview Ave
- 438 N Ridgeland Ave