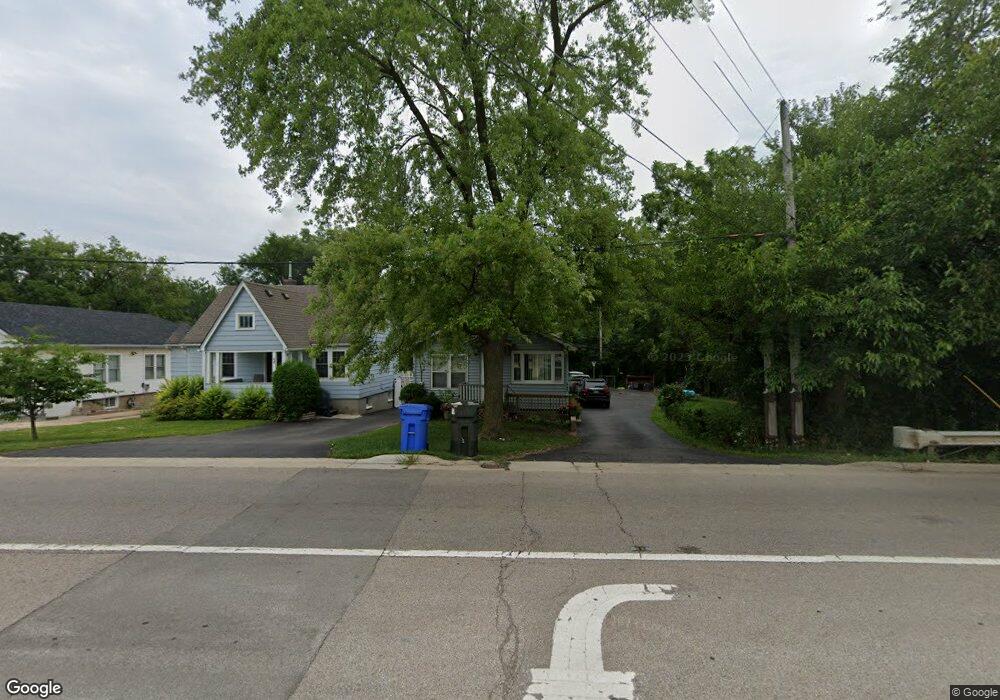
443 N La Fox St South Elgin, IL 60177
Estimated Value: $235,000 - $267,314
3
Beds
1
Bath
1,155
Sq Ft
$218/Sq Ft
Est. Value
About This Home
This home is located at 443 N La Fox St, South Elgin, IL 60177 and is currently estimated at $251,579, approximately $217 per square foot. 443 N La Fox St is a home located in Kane County with nearby schools including Willard Elementary School, Kenyon Woods Middle School, and South Elgin High School.
Ownership History
Date
Name
Owned For
Owner Type
Purchase Details
Closed on
Nov 5, 1998
Sold by
Mclaughlin Michael A and Mclaughlin Tamara L
Bought by
Estrada Concepcion and Estrada Esther
Current Estimated Value
Home Financials for this Owner
Home Financials are based on the most recent Mortgage that was taken out on this home.
Original Mortgage
$97,850
Outstanding Balance
$21,527
Interest Rate
6.68%
Estimated Equity
$230,052
Purchase Details
Closed on
Jun 13, 1997
Sold by
Mclaughlin Michael A and Mclaughlin Tamra L
Bought by
Mclaughlin Michael A and Mclaughlin Tamra L
Home Financials for this Owner
Home Financials are based on the most recent Mortgage that was taken out on this home.
Original Mortgage
$86,400
Interest Rate
11.5%
Create a Home Valuation Report for This Property
The Home Valuation Report is an in-depth analysis detailing your home's value as well as a comparison with similar homes in the area
Home Values in the Area
Average Home Value in this Area
Purchase History
| Date | Buyer | Sale Price | Title Company |
|---|---|---|---|
| Estrada Concepcion | $103,000 | Chicago Title Insurance Co | |
| Mclaughlin Michael A | -- | Fox Title Company |
Source: Public Records
Mortgage History
| Date | Status | Borrower | Loan Amount |
|---|---|---|---|
| Open | Estrada Concepcion | $97,850 | |
| Previous Owner | Mclaughlin Michael A | $86,400 |
Source: Public Records
Tax History Compared to Growth
Tax History
| Year | Tax Paid | Tax Assessment Tax Assessment Total Assessment is a certain percentage of the fair market value that is determined by local assessors to be the total taxable value of land and additions on the property. | Land | Improvement |
|---|---|---|---|---|
| 2024 | $4,438 | $72,241 | $12,703 | $59,538 |
| 2023 | $4,133 | $65,264 | $11,476 | $53,788 |
| 2022 | $4,174 | $59,509 | $10,464 | $49,045 |
| 2021 | $4,323 | $55,637 | $9,783 | $45,854 |
| 2020 | $4,183 | $53,114 | $9,339 | $43,775 |
| 2019 | $4,559 | $50,594 | $8,896 | $41,698 |
| 2018 | $4,492 | $47,663 | $8,381 | $39,282 |
| 2017 | $4,290 | $45,059 | $7,923 | $37,136 |
| 2016 | $4,115 | $41,802 | $7,350 | $34,452 |
| 2015 | -- | $38,315 | $6,737 | $31,578 |
| 2014 | -- | $37,842 | $6,654 | $31,188 |
| 2013 | -- | $38,841 | $6,830 | $32,011 |
Source: Public Records
Map
Nearby Homes
- 275 Quarry St
- 550 N Center St
- 120 Melrose Ct
- 1052 Moraine Dr
- 1071 Moraine Dr
- 2376 Southwind Blvd
- 295 S Walnut St
- 300 N South Elgin Blvd
- 194 S Collins St
- 303 Ann St
- 328 Hickory Ln
- 336 Windsor Ct Unit D
- 387 S Pointe Ave
- 773 Michigan Ave
- 200 Patrick Dr
- 590 Fenwick Ln
- 280 Woodridge Cir Unit E
- 295 Woodridge Cir Unit F
- 7N905 Woodcliff Dr
- 447 Hancock Ave