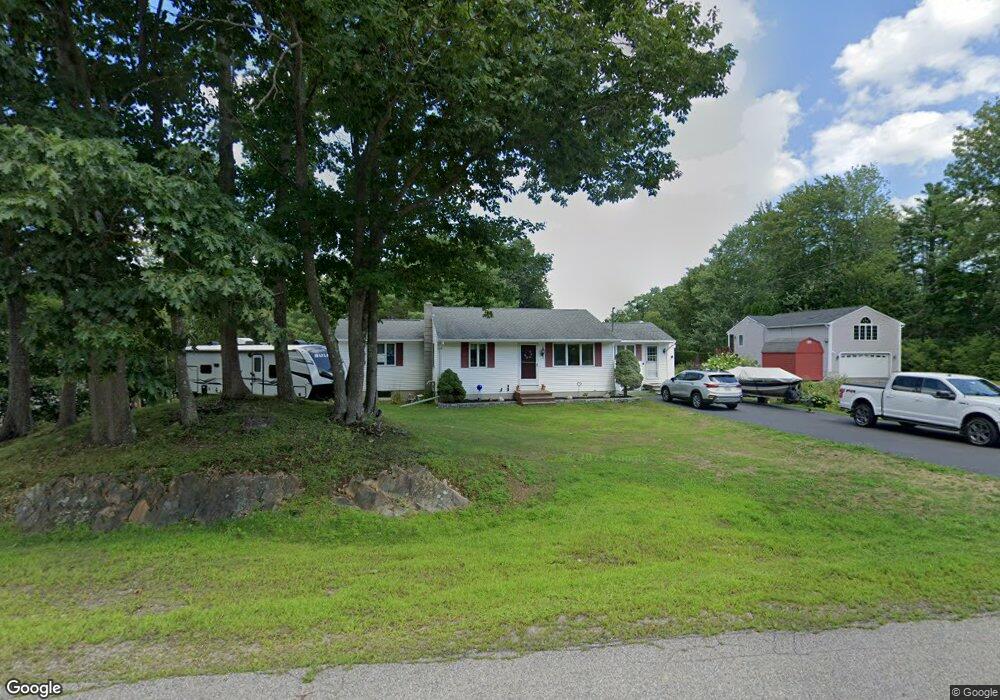
443 Pool St Biddeford, ME 04005
South Biddeford NeighborhoodEstimated Value: $451,590 - $535,000
2
Beds
1
Bath
1,168
Sq Ft
$416/Sq Ft
Est. Value
About This Home
This home is located at 443 Pool St, Biddeford, ME 04005 and is currently estimated at $485,898, approximately $416 per square foot. 443 Pool St is a home located in York County with nearby schools including John F Kennedy Memorial School, Biddeford Primary School, and Biddeford Intermediate School.
Ownership History
Date
Name
Owned For
Owner Type
Purchase Details
Closed on
Jan 26, 2010
Sold by
Morin Donald G and Morin Michael G
Bought by
Morin Graig M
Current Estimated Value
Home Financials for this Owner
Home Financials are based on the most recent Mortgage that was taken out on this home.
Original Mortgage
$149,900
Outstanding Balance
$96,023
Interest Rate
4.79%
Mortgage Type
Purchase Money Mortgage
Estimated Equity
$389,875
Create a Home Valuation Report for This Property
The Home Valuation Report is an in-depth analysis detailing your home's value as well as a comparison with similar homes in the area
Home Values in the Area
Average Home Value in this Area
Purchase History
| Date | Buyer | Sale Price | Title Company |
|---|---|---|---|
| Morin Graig M | -- | -- |
Source: Public Records
Mortgage History
| Date | Status | Borrower | Loan Amount |
|---|---|---|---|
| Open | Morin Graig M | $149,900 |
Source: Public Records
Tax History
| Year | Tax Paid | Tax Assessment Tax Assessment Total Assessment is a certain percentage of the fair market value that is determined by local assessors to be the total taxable value of land and additions on the property. | Land | Improvement |
|---|---|---|---|---|
| 2025 | $6,502 | $435,200 | $219,700 | $215,500 |
| 2024 | $6,164 | $433,500 | $219,700 | $213,800 |
| 2023 | $5,635 | $429,500 | $215,700 | $213,800 |
| 2022 | $5,205 | $317,200 | $145,700 | $171,500 |
| 2021 | $4,929 | $270,400 | $123,200 | $147,200 |
| 2020 | $4,882 | $243,500 | $107,200 | $136,300 |
| 2019 | $4,865 | $243,500 | $107,200 | $136,300 |
| 2018 | $4,797 | $243,500 | $107,200 | $136,300 |
| 2017 | $4,558 | $227,100 | $107,200 | $119,900 |
| 2016 | $4,510 | $227,100 | $107,200 | $119,900 |
| 2015 | $4,227 | $227,100 | $107,200 | $119,900 |
| 2014 | $4,123 | $227,100 | $107,200 | $119,900 |
| 2013 | -- | $232,600 | $106,900 | $125,700 |
Source: Public Records
Map
Nearby Homes
- 625 Pool St
- 650 Pool St
- 5 Twin Island Dr
- 26 Meeting House Rd
- 74 Guinea Rd
- 378 Pool St
- 9 Windward Ridge
- 4 Walker Dr Unit 101
- 3 Walker Dr Unit 101
- 3 Walker Dr Unit 101
- 353 Pool St
- TBD 530 Ferry Rd
- 295 Ferry Rd
- 8 Rockwood Dr
- 18 Camp Ellis Ave
- 1 Main Ave
- 10 Lower Beach Rd
- 343 Pool St
- 9 Riverside Ave
- 30 Vines Rd
Your Personal Tour Guide
Ask me questions while you tour the home.