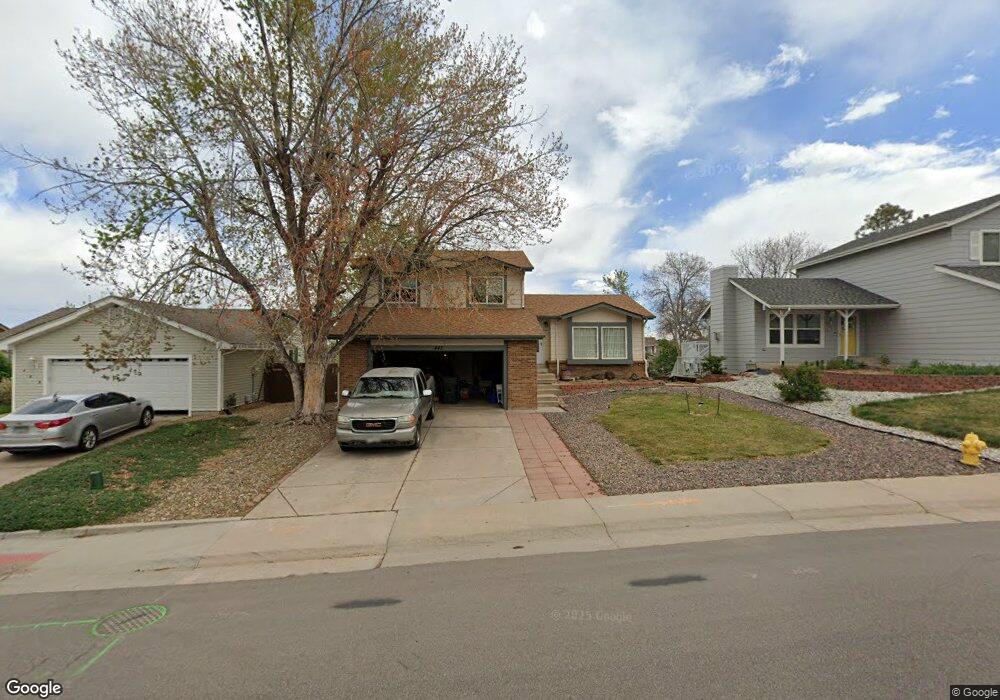
443 Southpark Rd Highlands Ranch, CO 80126
Northridge NeighborhoodEstimated Value: $584,000 - $606,000
3
Beds
2
Baths
1,663
Sq Ft
$361/Sq Ft
Est. Value
About This Home
This home is located at 443 Southpark Rd, Highlands Ranch, CO 80126 and is currently estimated at $599,974, approximately $360 per square foot. 443 Southpark Rd is a home located in Douglas County with nearby schools including Northridge Elementary School, Mountain Ridge Middle School, and Mountain Vista High School.
Ownership History
Date
Name
Owned For
Owner Type
Purchase Details
Closed on
Jan 29, 1999
Sold by
Garcia Arnulfo R
Bought by
Guzman Martha and Contreras Cudberto
Current Estimated Value
Home Financials for this Owner
Home Financials are based on the most recent Mortgage that was taken out on this home.
Original Mortgage
$163,855
Interest Rate
6.89%
Mortgage Type
FHA
Purchase Details
Closed on
Nov 3, 1997
Sold by
Garcia Arnulfo R Et Al Garcia Peggy L
Bought by
Garcia Arnulfo R
Purchase Details
Closed on
Oct 31, 1997
Sold by
Garcia Arnulfo R and Garcia Peggy L
Bought by
Garcia Arnulfo R
Purchase Details
Closed on
Aug 27, 1987
Sold by
Mission Viejo Co
Bought by
Garcia Arnulfo R and Garcia Peggy L
Purchase Details
Closed on
Aug 14, 1987
Sold by
Public Trustee
Bought by
Mission Viejo Co
Purchase Details
Closed on
Aug 15, 1986
Sold by
Self David M and Self Judith L
Bought by
Heifner Jeff R and Heifner Luann
Purchase Details
Closed on
Dec 22, 1983
Sold by
Mission Viejo Co
Bought by
Self David M and Self Judith L
Create a Home Valuation Report for This Property
The Home Valuation Report is an in-depth analysis detailing your home's value as well as a comparison with similar homes in the area
Home Values in the Area
Average Home Value in this Area
Purchase History
| Date | Buyer | Sale Price | Title Company |
|---|---|---|---|
| Guzman Martha | $165,000 | -- | |
| Garcia Arnulfo R | -- | -- | |
| Garcia Arnulfo R | -- | -- | |
| Garcia Arnulfo R | $107,000 | -- | |
| Mission Viejo Co | -- | -- | |
| Heifner Jeff R | $110,000 | -- | |
| Self David M | $109,100 | -- |
Source: Public Records
Mortgage History
| Date | Status | Borrower | Loan Amount |
|---|---|---|---|
| Previous Owner | Guzman Martha | $163,855 |
Source: Public Records
Tax History Compared to Growth
Tax History
| Year | Tax Paid | Tax Assessment Tax Assessment Total Assessment is a certain percentage of the fair market value that is determined by local assessors to be the total taxable value of land and additions on the property. | Land | Improvement |
|---|---|---|---|---|
| 2024 | $3,704 | $42,980 | $9,970 | $33,010 |
| 2023 | $3,697 | $42,980 | $9,970 | $33,010 |
| 2022 | $2,857 | $31,270 | $6,820 | $24,450 |
| 2021 | $2,971 | $31,270 | $6,820 | $24,450 |
| 2020 | $2,732 | $29,460 | $6,500 | $22,960 |
| 2019 | $2,742 | $29,460 | $6,500 | $22,960 |
| 2018 | $2,420 | $25,610 | $5,700 | $19,910 |
| 2017 | $2,204 | $25,610 | $5,700 | $19,910 |
| 2016 | $2,040 | $23,270 | $5,240 | $18,030 |
| 2015 | $2,084 | $23,270 | $5,240 | $18,030 |
| 2014 | $1,811 | $18,670 | $4,940 | $13,730 |
Source: Public Records
Map
Nearby Homes
- 540 Snowy Owl Place
- 495 Ridgeglen Way
- 145 Blue Spruce Ct
- 9170 Stargrass Cir
- 8975 S Coyote St
- 9191 Hickory Cir
- 715 Myrtlewood Ct
- 966 Cherry Blossom Ct
- 996 Cherry Blossom Ct
- 1146 Cherry Blossom Ct
- 669 Walden Ct
- 331 Mountain Chickadee Rd
- 867 Summer Dr Unit 9C
- 745 Stowe St
- 842 Summer Dr Unit 3E
- 1055 Northridge Rd
- 1053 Fieldstone Place
- 9492 Joyce Ln
- 9510 Joyce Ln
- 9361 Crestmore Way
- 423 Southpark Rd
- 463 Southpark Rd
- 8961 Winrock St
- 403 Southpark Rd
- 483 Southpark Rd
- 8965 Winrock St
- 8971 Winrock St
- 8957 Winrock St
- 503 Southpark Rd
- 462 Southpark Rd
- 471 Quail Ridge Cir
- 395 Mountain Cloud Cir
- 8975 Winrock St
- 385 Mountain Cloud Cir
- 8953 Winrock St
- 513 Southpark Rd
- 502 Southpark Rd
- 461 Quail Ridge Cir
- 8981 Winrock St
- 375 Mountain Cloud Cir