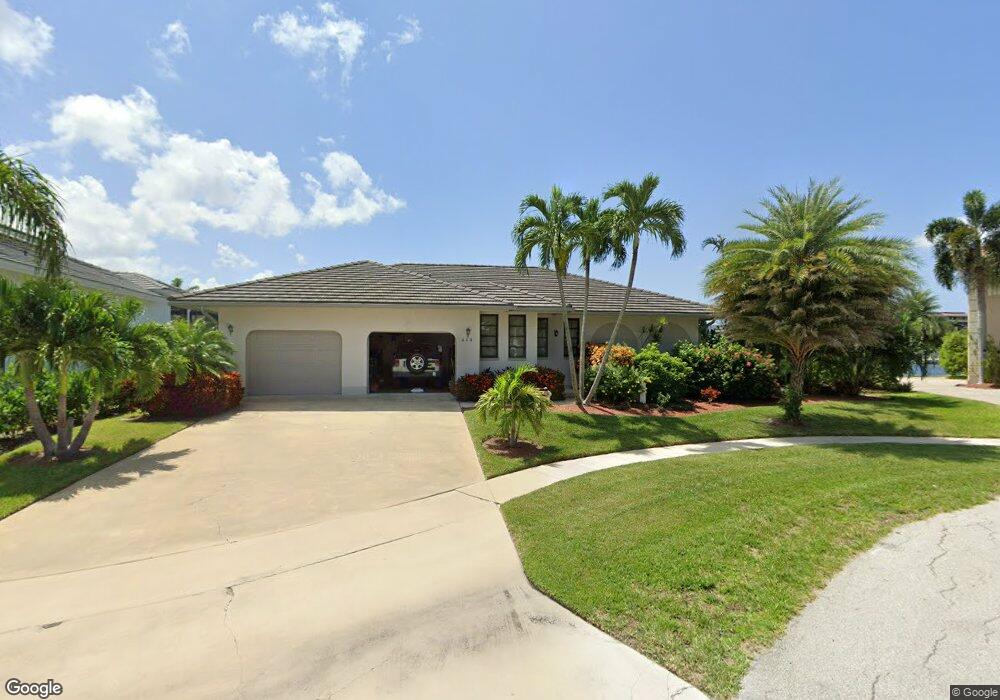
443 Trent Ct Marco Island, FL 34145
Estimated Value: $1,165,000 - $1,423,000
3
Beds
2
Baths
1,703
Sq Ft
$777/Sq Ft
Est. Value
About This Home
This home is located at 443 Trent Ct, Marco Island, FL 34145 and is currently estimated at $1,323,319, approximately $777 per square foot. 443 Trent Ct is a home located in Collier County with nearby schools including Tommie Barfield Elementary School, Manatee Middle School, and Lely High School.
Ownership History
Date
Name
Owned For
Owner Type
Purchase Details
Closed on
Mar 23, 2022
Sold by
Baker John E
Bought by
John Eric Baker Intervivos Trust
Current Estimated Value
Purchase Details
Closed on
May 18, 2011
Sold by
Sroka John and Sroka Wieslawa
Bought by
Baker John E and Baker Eric R
Home Financials for this Owner
Home Financials are based on the most recent Mortgage that was taken out on this home.
Original Mortgage
$350,000
Interest Rate
4.88%
Mortgage Type
New Conventional
Purchase Details
Closed on
Feb 11, 2003
Sold by
Downey Paul and Downey Susan C
Bought by
Sroka John and Sroka Wieslawn
Home Financials for this Owner
Home Financials are based on the most recent Mortgage that was taken out on this home.
Original Mortgage
$500,000
Interest Rate
5.93%
Mortgage Type
Purchase Money Mortgage
Purchase Details
Closed on
Sep 20, 2002
Sold by
Downey Paul
Bought by
Downey Paul and Downey Susan C
Create a Home Valuation Report for This Property
The Home Valuation Report is an in-depth analysis detailing your home's value as well as a comparison with similar homes in the area
Home Values in the Area
Average Home Value in this Area
Purchase History
| Date | Buyer | Sale Price | Title Company |
|---|---|---|---|
| John Eric Baker Intervivos Trust | -- | Fred W Mundie Jr Pa | |
| Baker John E | $440,000 | Attorney | |
| Sroka John | $625,000 | -- | |
| Downey Paul | -- | -- |
Source: Public Records
Mortgage History
| Date | Status | Borrower | Loan Amount |
|---|---|---|---|
| Previous Owner | Baker John E | $350,000 | |
| Previous Owner | Sroka John | $500,000 |
Source: Public Records
Tax History Compared to Growth
Tax History
| Year | Tax Paid | Tax Assessment Tax Assessment Total Assessment is a certain percentage of the fair market value that is determined by local assessors to be the total taxable value of land and additions on the property. | Land | Improvement |
|---|---|---|---|---|
| 2025 | $5,017 | $576,216 | -- | -- |
| 2024 | $4,996 | $559,977 | -- | -- |
| 2023 | $4,996 | $543,667 | $0 | $0 |
| 2022 | $5,188 | $527,832 | $0 | $0 |
| 2021 | $5,352 | $512,458 | $0 | $0 |
| 2020 | $5,248 | $505,383 | $0 | $0 |
| 2019 | $5,213 | $494,021 | $0 | $0 |
| 2018 | $4,570 | $434,855 | $0 | $0 |
| 2017 | $5,109 | $478,759 | $0 | $0 |
| 2016 | $5,047 | $468,912 | $0 | $0 |
| 2015 | $5,146 | $465,652 | $0 | $0 |
| 2014 | $5,156 | $411,956 | $0 | $0 |
Source: Public Records
Map
Nearby Homes