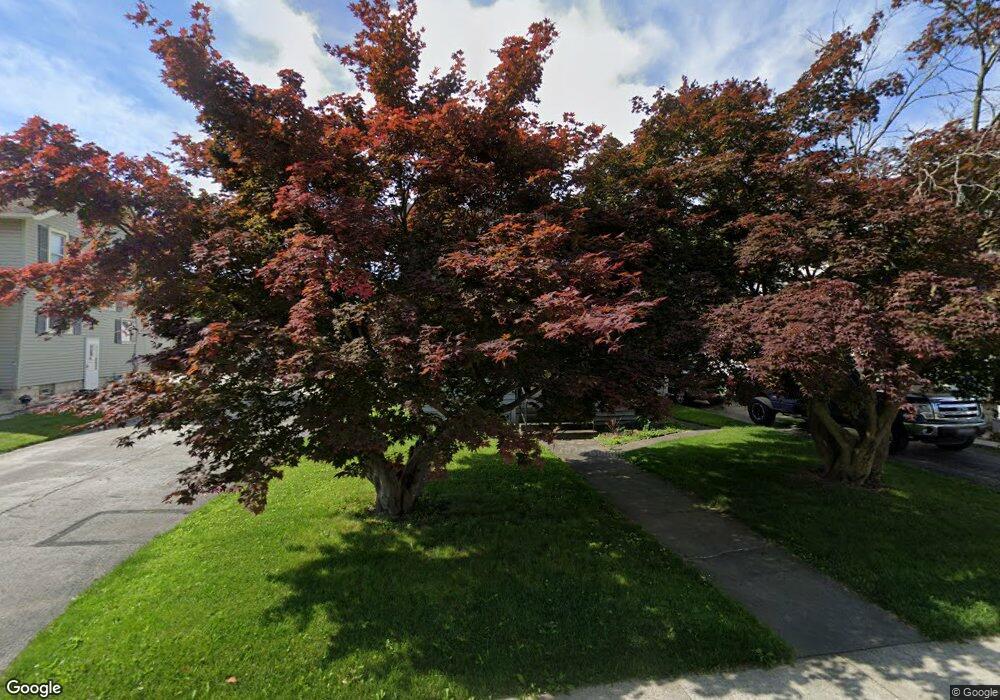
443 Union Ct Fostoria, OH 44830
Estimated Value: $101,000 - $141,000
2
Beds
1
Bath
801
Sq Ft
$144/Sq Ft
Est. Value
About This Home
This home is located at 443 Union Ct, Fostoria, OH 44830 and is currently estimated at $115,338, approximately $143 per square foot. 443 Union Ct is a home located in Seneca County with nearby schools including Fostoria Intermediate Elementary School and Fostoria Junior/Senior High School.
Ownership History
Date
Name
Owned For
Owner Type
Purchase Details
Closed on
Dec 4, 2009
Sold by
Kiser Justin W
Bought by
Brian Cory D
Current Estimated Value
Home Financials for this Owner
Home Financials are based on the most recent Mortgage that was taken out on this home.
Original Mortgage
$60,750
Outstanding Balance
$39,868
Interest Rate
5.02%
Mortgage Type
New Conventional
Estimated Equity
$75,470
Purchase Details
Closed on
Dec 19, 2008
Sold by
Sayre Stanley E and Sayre Ruth J
Bought by
Kiser Justin W
Home Financials for this Owner
Home Financials are based on the most recent Mortgage that was taken out on this home.
Original Mortgage
$51,510
Interest Rate
6.06%
Mortgage Type
FHA
Purchase Details
Closed on
May 12, 1997
Sold by
Herbert Brian R
Bought by
Sayre Ruth J
Purchase Details
Closed on
Apr 23, 1993
Sold by
Gilliland Donna Louise
Bought by
Herbert Brian R
Create a Home Valuation Report for This Property
The Home Valuation Report is an in-depth analysis detailing your home's value as well as a comparison with similar homes in the area
Home Values in the Area
Average Home Value in this Area
Purchase History
| Date | Buyer | Sale Price | Title Company |
|---|---|---|---|
| Brian Cory D | $55,000 | Centennial Title Agency | |
| Kiser Justin W | $50,500 | Assured Title | |
| Sayre Ruth J | $48,000 | -- | |
| Herbert Brian R | $42,500 | -- |
Source: Public Records
Mortgage History
| Date | Status | Borrower | Loan Amount |
|---|---|---|---|
| Open | Brian Cory D | $60,750 | |
| Previous Owner | Kiser Justin W | $51,510 |
Source: Public Records
Tax History Compared to Growth
Tax History
| Year | Tax Paid | Tax Assessment Tax Assessment Total Assessment is a certain percentage of the fair market value that is determined by local assessors to be the total taxable value of land and additions on the property. | Land | Improvement |
|---|---|---|---|---|
| 2024 | $1,046 | $20,800 | $2,240 | $18,560 |
| 2023 | $1,048 | $20,800 | $2,240 | $18,560 |
| 2022 | $908 | $16,050 | $1,940 | $14,110 |
| 2021 | $928 | $16,050 | $1,940 | $14,110 |
| 2020 | $932 | $16,048 | $1,936 | $14,112 |
| 2019 | $888 | $15,169 | $1,869 | $13,300 |
| 2018 | $906 | $15,169 | $1,869 | $13,300 |
| 2017 | $905 | $15,169 | $1,869 | $13,300 |
| 2016 | $893 | $16,751 | $2,065 | $14,686 |
| 2015 | $878 | $16,751 | $2,065 | $14,686 |
| 2014 | $835 | $16,751 | $2,065 | $14,686 |
| 2013 | $969 | $17,973 | $2,244 | $15,729 |
Source: Public Records
Map
Nearby Homes
- 375 Thomas St
- 1324 N Union St
- 900 N Countyline St
- 892 N Countyline St
- 931 N Union St
- 727 Eisenhower Dr
- 901 Central Ave
- 723 N Union St
- 633 Maple St
- 520 N Union St
- 827 Buckley St
- 540 N Poplar St
- 220 E High St
- 509 College Ave
- 203 N Union St
- 711 Circle Dr
- 634 W Tiffin St
- 481 Beverly Dr
- 348 W South St
- 351 W South St