443 Vining Branch Rd Unit 5-8 Georgetown, GA 39854
Estimated Value: $464,000 - $820,000
3
Beds
2
Baths
3,450
Sq Ft
$187/Sq Ft
Est. Value
About This Home
This home is located at 443 Vining Branch Rd Unit 5-8, Georgetown, GA 39854 and is currently estimated at $646,345, approximately $187 per square foot. 443 Vining Branch Rd Unit 5-8 is a home located in Quitman County with nearby schools including Quitman County Elementary School and Quitman County High School.
Ownership History
Date
Name
Owned For
Owner Type
Purchase Details
Closed on
Feb 16, 2018
Sold by
Slay Kenneth E
Bought by
Eriksen Paul and Eriksen Heather
Current Estimated Value
Home Financials for this Owner
Home Financials are based on the most recent Mortgage that was taken out on this home.
Original Mortgage
$230,000
Outstanding Balance
$194,138
Interest Rate
4.04%
Mortgage Type
New Conventional
Estimated Equity
$452,207
Purchase Details
Closed on
Sep 12, 2001
Sold by
Wisenbaker Kathrine
Bought by
Slay Kenneth and Slay Jeann
Purchase Details
Closed on
Dec 5, 1983
Sold by
Atwater Lula H
Bought by
Wisenbaker Kathrine
Purchase Details
Closed on
Apr 29, 1983
Sold by
Peddie Malone and Peddie Clar
Bought by
Atwater Lula H
Purchase Details
Closed on
Jan 4, 1983
Sold by
Ford
Bought by
Peddie Malone and Peddie Clar
Purchase Details
Closed on
Jan 1, 1901
Bought by
Ford
Create a Home Valuation Report for This Property
The Home Valuation Report is an in-depth analysis detailing your home's value as well as a comparison with similar homes in the area
Home Values in the Area
Average Home Value in this Area
Purchase History
| Date | Buyer | Sale Price | Title Company |
|---|---|---|---|
| Eriksen Paul | $459,500 | -- | |
| Slay Kenneth | $21,000 | -- | |
| Wisenbaker Kathrine | -- | -- | |
| Atwater Lula H | -- | -- | |
| Peddie Malone | -- | -- | |
| Ford | -- | -- |
Source: Public Records
Mortgage History
| Date | Status | Borrower | Loan Amount |
|---|---|---|---|
| Open | Eriksen Paul | $230,000 |
Source: Public Records
Tax History Compared to Growth
Tax History
| Year | Tax Paid | Tax Assessment Tax Assessment Total Assessment is a certain percentage of the fair market value that is determined by local assessors to be the total taxable value of land and additions on the property. | Land | Improvement |
|---|---|---|---|---|
| 2025 | $6,909 | $224,055 | $101,400 | $122,655 |
| 2024 | $6,909 | $224,055 | $101,400 | $122,655 |
| 2023 | $7,048 | $224,055 | $101,400 | $122,655 |
| 2022 | $6,027 | $224,055 | $101,400 | $122,655 |
| 2021 | $6,758 | $209,869 | $112,307 | $97,562 |
| 2020 | $6,753 | $209,869 | $112,307 | $97,562 |
| 2019 | $2,990 | $178,748 | $81,186 | $97,562 |
| 2018 | $5,722 | $178,748 | $81,186 | $97,562 |
| 2017 | $2,929 | $181,138 | $81,186 | $99,952 |
| 2016 | $3,226 | $202,830 | $108,000 | $94,830 |
| 2015 | -- | $202,830 | $108,000 | $94,830 |
| 2014 | -- | $202,830 | $108,000 | $94,830 |
| 2013 | -- | $204,990 | $110,160 | $94,830 |
Source: Public Records
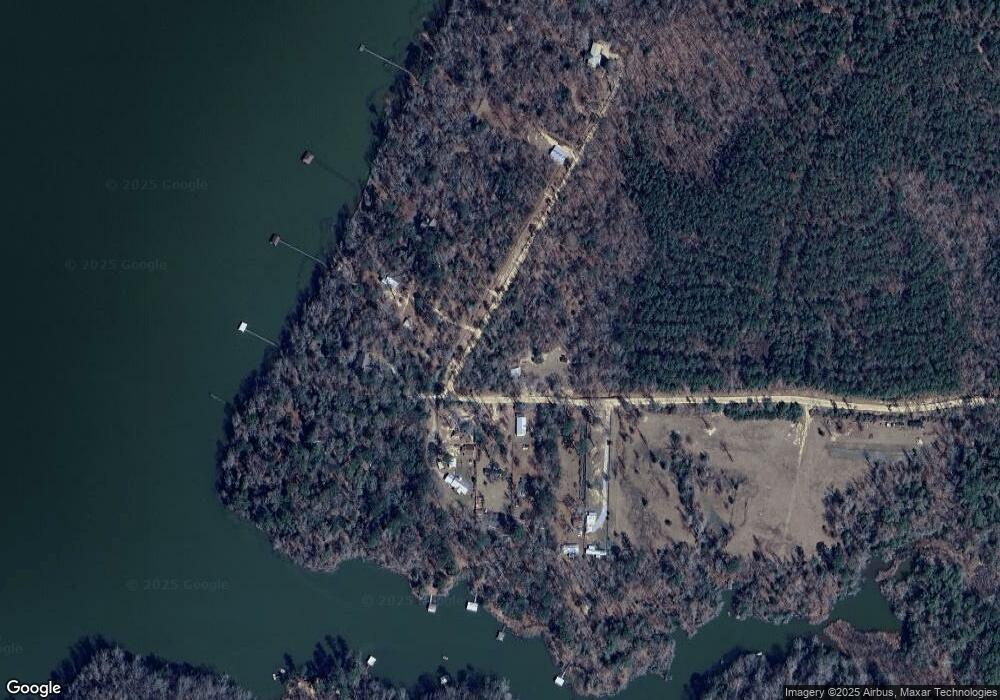
Map
Nearby Homes
- 0 Watson Spur Rd Unit 24072
- 0 Watson Spur Rd Unit 189883
- 0 Watson Spur Rd Unit 20115025
- 0 U S 431 N
- 330 Georgia 27
- 253 Kaigler Rd
- 00 Georgia 39
- 2+/- Ac Fawn Dr
- #7 Point Dr
- 0 Point Dr Unit LOT 2, 3, 4
- 0 Sandra Dr Unit 10544581
- 0 Sandra Dr Unit 27509
- 98 Sunrise Dr
- 76 Jacqueline Dr
- 0 Mandaville Rd Unit 27632
- 0 Jacqueline Dr
- Lot 12 Sunrise Dr
- 0 N Eufaula Ave
- Parcel B Collinswood Dr
- 1194 U S Hwy 82-Parcel B
- 443 Vining Branch Rd
- 439 Vining Branch Rd
- 471 Vining Branch Rd
- 471 Vining Branch Rd
- 418 Vining Branch Rd
- 430 Vining Branch Rd
- 427 Vining Branch Rd
- 429 Vining Branch Rd
- 475 Vining Branch Rd
- 280 Watson Rd
- 216 Ga Highway 39 N
- 284 Watson Rd Unit 7
- 284 Watson Rd
- 25 Watson Rd
- 231 Watson Rd
- 208 Watson Rd
- 192 Watson Rd
- 288 Watson Rd
- 288 Watson Rd
- 0 Lot 3 Watson S D Vining Branch Rd