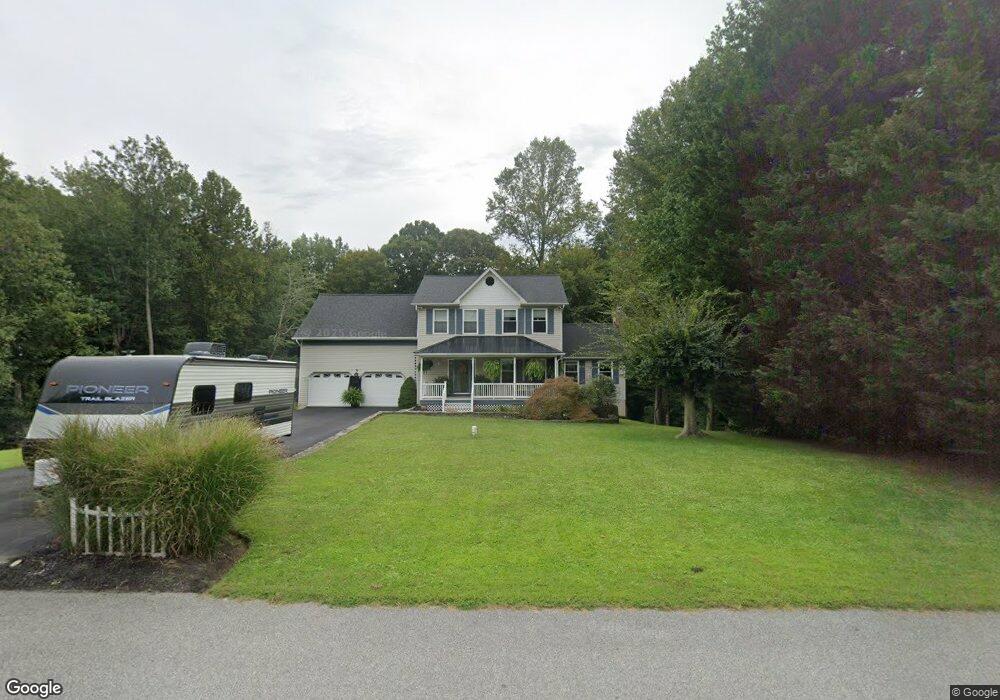
4430 Bristol Dr Chesapeake Beach, MD 20732
Estimated Value: $582,000 - $626,000
4
Beds
4
Baths
4,840
Sq Ft
$125/Sq Ft
Est. Value
About This Home
This home is located at 4430 Bristol Dr, Chesapeake Beach, MD 20732 and is currently estimated at $602,628, approximately $124 per square foot. 4430 Bristol Dr is a home located in Calvert County with nearby schools including Sunderland Elementary School, Plum Point Middle School, and Huntingtown High School.
Ownership History
Date
Name
Owned For
Owner Type
Purchase Details
Closed on
Jul 21, 2008
Sold by
Wikoff Thomas Oren and Wikoff Deborah Ann
Bought by
Kent Christopher L and Kent Erin E
Current Estimated Value
Home Financials for this Owner
Home Financials are based on the most recent Mortgage that was taken out on this home.
Original Mortgage
$371,000
Outstanding Balance
$244,149
Interest Rate
6.47%
Mortgage Type
Purchase Money Mortgage
Estimated Equity
$358,479
Purchase Details
Closed on
Jul 17, 2008
Sold by
Wikoff Thomas Oren and Wikoff Deborah Ann
Bought by
Kent Christopher L and Kent Erin E
Home Financials for this Owner
Home Financials are based on the most recent Mortgage that was taken out on this home.
Original Mortgage
$371,000
Outstanding Balance
$244,149
Interest Rate
6.47%
Mortgage Type
Purchase Money Mortgage
Estimated Equity
$358,479
Purchase Details
Closed on
Nov 22, 1995
Sold by
Cleary Frank J
Bought by
Wikoff Thomas Oren and Wikoff Deborah Ann
Create a Home Valuation Report for This Property
The Home Valuation Report is an in-depth analysis detailing your home's value as well as a comparison with similar homes in the area
Home Values in the Area
Average Home Value in this Area
Purchase History
| Date | Buyer | Sale Price | Title Company |
|---|---|---|---|
| Kent Christopher L | $413,000 | -- | |
| Kent Christopher L | $413,000 | -- | |
| Wikoff Thomas Oren | $208,000 | -- |
Source: Public Records
Mortgage History
| Date | Status | Borrower | Loan Amount |
|---|---|---|---|
| Open | Kent Christopher L | $371,000 | |
| Closed | Kent Christopher L | $371,000 | |
| Closed | Wikoff Thomas Oren | -- |
Source: Public Records
Tax History Compared to Growth
Tax History
| Year | Tax Paid | Tax Assessment Tax Assessment Total Assessment is a certain percentage of the fair market value that is determined by local assessors to be the total taxable value of land and additions on the property. | Land | Improvement |
|---|---|---|---|---|
| 2025 | $4,859 | $451,200 | $160,100 | $291,100 |
| 2024 | $4,859 | $430,167 | $0 | $0 |
| 2023 | $4,465 | $409,133 | $0 | $0 |
| 2022 | $4,243 | $388,100 | $160,100 | $228,000 |
| 2021 | $4,054 | $378,400 | $0 | $0 |
| 2020 | $4,054 | $368,700 | $0 | $0 |
| 2019 | $3,968 | $359,000 | $160,100 | $198,900 |
| 2018 | $3,955 | $359,000 | $160,100 | $198,900 |
| 2017 | $4,006 | $359,000 | $0 | $0 |
| 2016 | -- | $362,500 | $0 | $0 |
| 2015 | $4,156 | $362,500 | $0 | $0 |
| 2014 | $4,156 | $362,500 | $0 | $0 |
Source: Public Records
Map
Nearby Homes
- 2785 Ponds Wood Rd
- 3545 Christiana Ct
- 2970 Stinnett Rd
- 4950 Hardesty Rd
- 3164 Dalrymple Rd
- 4115 Calvert Dr
- 3750 Elberta Ln
- 4685 Camp Roosevelt Dr
- 5150 Lenoir Dr
- 5209 Larchmont Dr
- 2825 Karen Dr
- 4790 Howard Place
- 2950 Tobacco Rd
- 3605 Samanthas Way
- 3106 Highview Rd
- 3671 Dory Brooks Rd
- 4327 Dalrymple Rd
- 2424 Wildflower Ln
- 6122 6th St
- 3664 Brookeside Dr
- 4440 Bristol Dr
- 4425 Bristol Dr
- 4435 Bristol Dr
- 4415 Bristol Dr
- 4450 Bristol Dr
- 4411 Bristol Dr
- 3320 Tiswood Ct
- 4475 Bristol Dr
- 3340 Tiswood Ct
- 3310 Tiswood Ct
- 4405 Bristol Dr
- 4445 Bristol Dr
- 4460 Bristol Dr
- 3345 Tiswood Ct
- 3422 Bristol Ct
- 4485 Bristol Dr
- 3402 Bristol Ct
- 3305 Tiswood Ct
- 3412 Bristol Ct
- 3307 Tiswood Ct