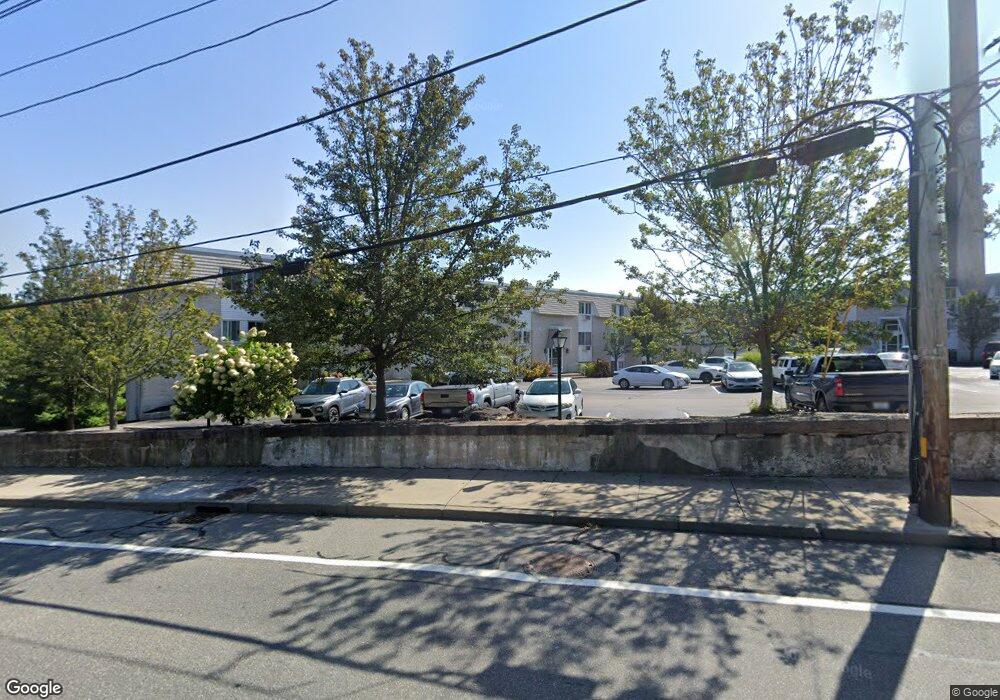
Ocean Point Condominiums 4430 Post Rd Unit 39C East Greenwich, RI 02818
Cowesett NeighborhoodEstimated Value: $264,000 - $306,000
1
Bed
1
Bath
625
Sq Ft
$459/Sq Ft
Est. Value
About This Home
This home is located at 4430 Post Rd Unit 39C, East Greenwich, RI 02818 and is currently estimated at $286,806, approximately $458 per square foot. 4430 Post Rd Unit 39C is a home located in Kent County with nearby schools including Our Lady of Mercy School and Rocky Hill Country Day School.
Ownership History
Date
Name
Owned For
Owner Type
Purchase Details
Closed on
Nov 19, 2024
Sold by
Rawcliffe John A and Rawcliffe Anni C
Bought by
Pelosi Jenna M
Current Estimated Value
Home Financials for this Owner
Home Financials are based on the most recent Mortgage that was taken out on this home.
Original Mortgage
$217,500
Outstanding Balance
$215,335
Interest Rate
6.12%
Mortgage Type
Purchase Money Mortgage
Estimated Equity
$71,471
Purchase Details
Closed on
Nov 21, 2017
Sold by
Gallo Michael P
Bought by
Rawcliffe John A and Rawcliffe Anni C
Purchase Details
Closed on
Aug 25, 2004
Sold by
Cipolla Claudia D and Vanover Clifford L
Bought by
Cipolla Michael and Cipolla Cludia D
Purchase Details
Closed on
Aug 20, 2002
Sold by
Grottadauria Paula A
Bought by
Gallo Michael P
Home Financials for this Owner
Home Financials are based on the most recent Mortgage that was taken out on this home.
Original Mortgage
$108,500
Interest Rate
6.61%
Create a Home Valuation Report for This Property
The Home Valuation Report is an in-depth analysis detailing your home's value as well as a comparison with similar homes in the area
Home Values in the Area
Average Home Value in this Area
Purchase History
| Date | Buyer | Sale Price | Title Company |
|---|---|---|---|
| Pelosi Jenna M | $277,500 | None Available | |
| Rawcliffe John A | $135,000 | -- | |
| Cipolla Michael | $155,000 | -- | |
| Gallo Michael P | $112,000 | -- |
Source: Public Records
Mortgage History
| Date | Status | Borrower | Loan Amount |
|---|---|---|---|
| Open | Pelosi Jenna M | $217,500 | |
| Previous Owner | Gallo Michael P | $108,500 |
Source: Public Records
Tax History Compared to Growth
Tax History
| Year | Tax Paid | Tax Assessment Tax Assessment Total Assessment is a certain percentage of the fair market value that is determined by local assessors to be the total taxable value of land and additions on the property. | Land | Improvement |
|---|---|---|---|---|
| 2024 | $2,143 | $148,100 | $0 | $148,100 |
| 2023 | $2,102 | $148,100 | $0 | $148,100 |
| 2022 | $2,274 | $121,400 | $0 | $121,400 |
| 2021 | $2,274 | $121,400 | $0 | $121,400 |
| 2020 | $2,274 | $121,400 | $0 | $121,400 |
| 2019 | $2,274 | $121,400 | $0 | $121,400 |
| 2018 | $2,115 | $101,700 | $0 | $101,700 |
| 2017 | $2,058 | $101,700 | $0 | $101,700 |
| 2016 | $2,058 | $101,700 | $0 | $101,700 |
| 2015 | $1,948 | $93,900 | $0 | $93,900 |
| 2014 | $1,884 | $93,900 | $0 | $93,900 |
| 2013 | $1,858 | $93,900 | $0 | $93,900 |
Source: Public Records
About Ocean Point Condominiums
Map
Nearby Homes
- 0 Spencer Ave
- 204 Spencer Ave
- 12 Manton St
- 4162 Post Rd Unit 12
- 27 King St
- 25 Water St Unit 101
- 32 Exchange St Unit A2
- 32 Exchange St Unit A1
- 32 Exchange St Unit 302
- 32 Exchange St Unit 203
- 32 Exchange St Unit 204
- 32 Exchange St Unit 103
- 32 Exchange St Unit 101
- 15 Castle St Unit 7
- 134 Duke St
- 22 Castle St Unit 3
- 136 Duke St
- 30 Eldredge Ave
- 121 Hedgerow Dr
- 50 Kenyon Ave
- 4430 Post Rd Unit 4A
- 4430 Post Rd Unit 46D
- 4430 Post Rd Unit 24B
- 4430 Post Rd Unit 19B
- 4430 Post Rd Unit 23B
- 4430 Post Rd Unit 8A
- 4430 Post Rd Unit 45D
- 4430 Post Rd Unit 69E
- 4430 Post Rd Unit 65E
- 4430 Post Rd Unit 25B
- 4430 Post Rd Unit 14A
- 4430 Post Rd Unit 62E
- 4430 Post Rd Unit 9A
- 4430 Post Rd Unit 7A
- 4430 Post Rd Unit 50D
- 4430 Post Rd Unit 20B
- 4430 Post Rd Unit 18B
- 4430 Post Rd Unit 47D
- 4430 Post Rd Unit 63E
- 4430 Post Rd Unit 58E