Estimated Value: $438,000 - $474,263
3
Beds
2
Baths
3,052
Sq Ft
$150/Sq Ft
Est. Value
About This Home
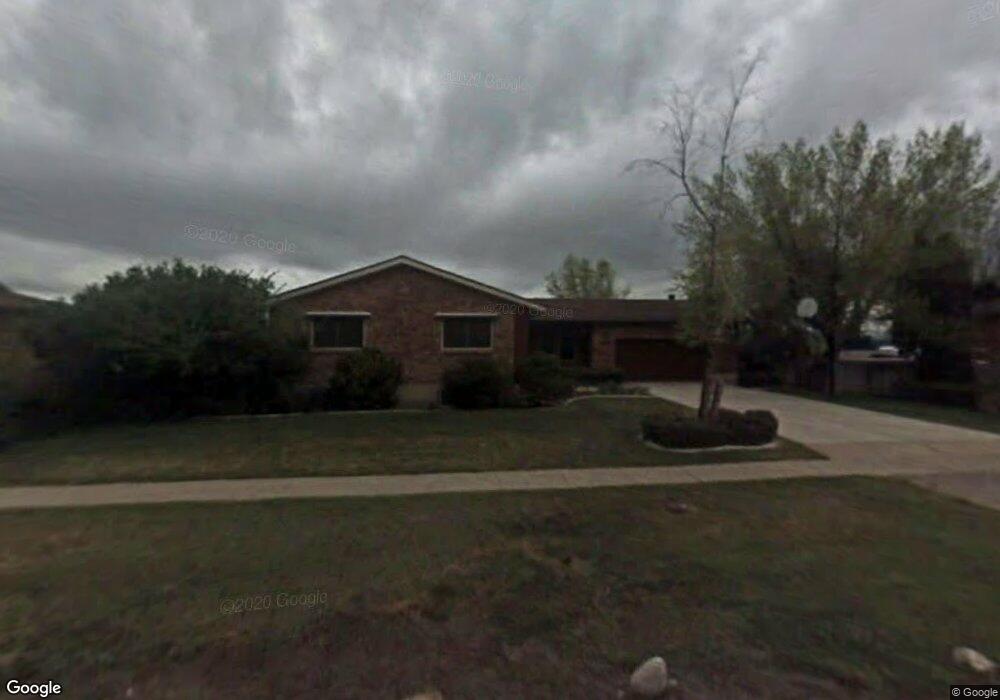
This home is located at 4430 S 1610 W, Roy, UT 84067 and is currently estimated at $456,566, approximately $149 per square foot. 4430 S 1610 W is a home located in Weber County with nearby schools including Valley View School, Sand Ridge Junior High School, and Roy High School.
Ownership History
Date
Name
Owned For
Owner Type
Purchase Details
Closed on
Oct 13, 2000
Sold by
Associates Relocation Management Co Inc
Bought by
Johnson Bruce A and Johnson Yong I
Current Estimated Value
Home Financials for this Owner
Home Financials are based on the most recent Mortgage that was taken out on this home.
Original Mortgage
$87,500
Interest Rate
7.66%
Purchase Details
Closed on
May 8, 2000
Sold by
Carver Dan Lewis and Carver Cindy Ann
Bought by
Associates Relocation Management Co Inc
Purchase Details
Closed on
Dec 13, 1996
Sold by
Brookens Bill J and Brookens Helen S
Bought by
Carver Dan Lewis and Carver Cindy Ann
Home Financials for this Owner
Home Financials are based on the most recent Mortgage that was taken out on this home.
Original Mortgage
$114,400
Interest Rate
7.76%
Create a Home Valuation Report for This Property
The Home Valuation Report is an in-depth analysis detailing your home's value as well as a comparison with similar homes in the area
Home Values in the Area
Average Home Value in this Area
Purchase History
| Date | Buyer | Sale Price | Title Company |
|---|---|---|---|
| Johnson Bruce A | -- | Founders Title Co | |
| Associates Relocation Management Co Inc | -- | Founders Title | |
| Carver Dan Lewis | -- | Bonneville Title |
Source: Public Records
Mortgage History
| Date | Status | Borrower | Loan Amount |
|---|---|---|---|
| Closed | Johnson Bruce A | $87,500 | |
| Previous Owner | Carver Dan Lewis | $114,400 |
Source: Public Records
Tax History
| Year | Tax Paid | Tax Assessment Tax Assessment Total Assessment is a certain percentage of the fair market value that is determined by local assessors to be the total taxable value of land and additions on the property. | Land | Improvement |
|---|---|---|---|---|
| 2025 | $265 | $458,385 | $155,000 | $303,385 |
| 2024 | $838 | $248,049 | $85,258 | $162,791 |
| 2023 | $2,210 | $239,800 | $82,387 | $157,413 |
| 2022 | $2,572 | $233,750 | $66,004 | $167,746 |
| 2021 | $1,924 | $334,000 | $85,012 | $248,988 |
| 2020 | $1,720 | $281,000 | $85,012 | $195,988 |
| 2019 | $2,023 | $262,000 | $49,940 | $212,060 |
| 2018 | $1,899 | $231,000 | $45,019 | $185,981 |
| 2017 | $1,753 | $199,000 | $45,019 | $153,981 |
| 2016 | $1,685 | $102,809 | $24,652 | $78,157 |
| 2015 | $1,557 | $97,100 | $21,944 | $75,156 |
| 2014 | $1,452 | $88,750 | $21,944 | $66,806 |
Source: Public Records
Map
Nearby Homes
- 4593 Promenade Dr Unit 16
- 4602 Hathaway Dr
- 4539 S 1800 W Unit 127
- 4536 S 1900 W Unit 12
- 4642 S 1900 W Unit 41
- 1114 W 4650 S
- 1783 W 5000 S
- 1789 W 5000 S
- 2038 W 4600 S
- 2015 W 4225 S
- 1765 W 5000 S
- 5006 S 1800 W
- 1838 W 5050 S
- 4220 S 2075 W
- 4533 S 2075 W
- 1829 W 5050 S
- 1959 3985 St S Unit 2
- 4328 S 2175 W
- 1910 W 3920 S
- 1779 W 5125 S