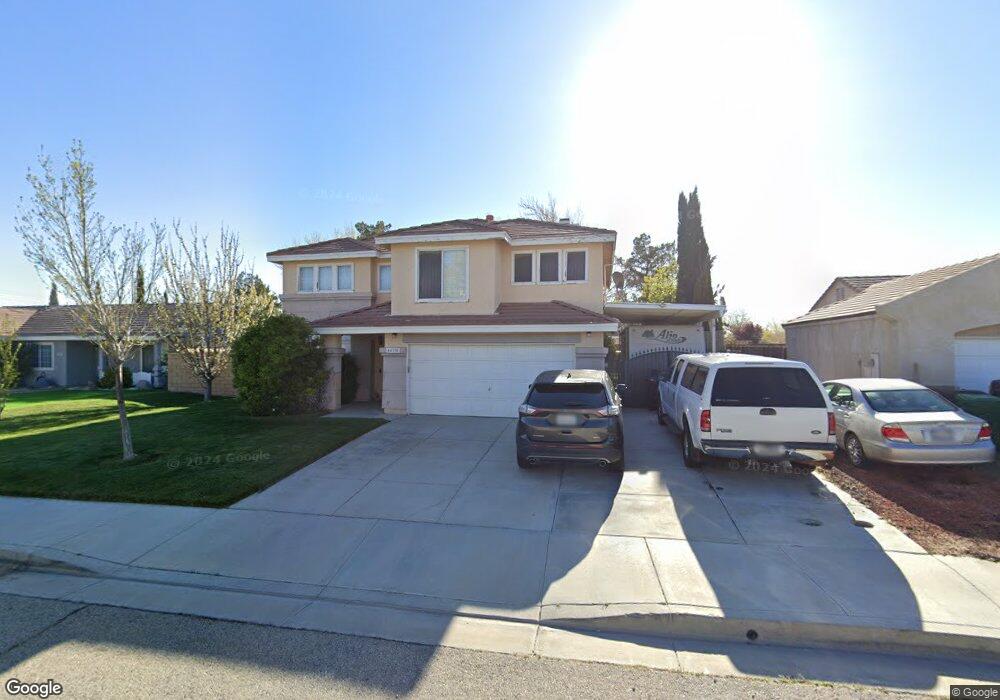
44318 Freer Way Lancaster, CA 93536
West Lancaster NeighborhoodEstimated Value: $484,000 - $493,000
4
Beds
3
Baths
1,770
Sq Ft
$276/Sq Ft
Est. Value
About This Home
This home is located at 44318 Freer Way, Lancaster, CA 93536 and is currently estimated at $487,847, approximately $275 per square foot. 44318 Freer Way is a home located in Los Angeles County with nearby schools including Sundown Elementary School, Quartz Hill High School, and Fabunni Private School Inc..
Ownership History
Date
Name
Owned For
Owner Type
Purchase Details
Closed on
Jul 7, 1998
Sold by
P & R Investments
Bought by
Hermans Donald and Hermans Lilia
Current Estimated Value
Home Financials for this Owner
Home Financials are based on the most recent Mortgage that was taken out on this home.
Original Mortgage
$119,340
Outstanding Balance
$24,210
Interest Rate
6.9%
Mortgage Type
VA
Estimated Equity
$463,637
Purchase Details
Closed on
Oct 28, 1997
Sold by
Va
Bought by
Pocker Assaf
Home Financials for this Owner
Home Financials are based on the most recent Mortgage that was taken out on this home.
Original Mortgage
$67,500
Interest Rate
7.3%
Mortgage Type
Seller Take Back
Purchase Details
Closed on
Oct 27, 1997
Sold by
Oren Ruth E
Bought by
Pocker Assaf
Home Financials for this Owner
Home Financials are based on the most recent Mortgage that was taken out on this home.
Original Mortgage
$67,500
Interest Rate
7.3%
Mortgage Type
Seller Take Back
Purchase Details
Closed on
May 23, 1995
Sold by
Kaufman & Broad Mtg Company
Bought by
Va
Create a Home Valuation Report for This Property
The Home Valuation Report is an in-depth analysis detailing your home's value as well as a comparison with similar homes in the area
Home Values in the Area
Average Home Value in this Area
Purchase History
| Date | Buyer | Sale Price | Title Company |
|---|---|---|---|
| Hermans Donald | $119,500 | Fidelity National Title Co | |
| P & R Investments | $1,000 | Fidelity National Title Co | |
| Pocker Assaf | $75,000 | Fidelity Title | |
| Pocker Assaf | -- | Fidelity Title | |
| Va | -- | American Title Company | |
| Kaufman & Broad Mtg Company | $111,913 | Fidelity National Title Ins |
Source: Public Records
Mortgage History
| Date | Status | Borrower | Loan Amount |
|---|---|---|---|
| Open | Hermans Donald | $119,340 | |
| Previous Owner | Pocker Assaf | $67,500 |
Source: Public Records
Tax History
| Year | Tax Paid | Tax Assessment Tax Assessment Total Assessment is a certain percentage of the fair market value that is determined by local assessors to be the total taxable value of land and additions on the property. | Land | Improvement |
|---|---|---|---|---|
| 2025 | $3,826 | $195,736 | $31,340 | $164,396 |
| 2024 | $3,826 | $191,899 | $30,726 | $161,173 |
| 2023 | $3,783 | $188,137 | $30,124 | $158,013 |
| 2022 | $3,591 | $184,449 | $29,534 | $154,915 |
| 2021 | $3,196 | $180,833 | $28,955 | $151,878 |
| 2019 | $3,124 | $175,472 | $28,098 | $147,374 |
| 2018 | $3,082 | $172,033 | $27,548 | $144,485 |
| 2016 | $2,929 | $165,354 | $26,479 | $138,875 |
| 2015 | $2,899 | $162,871 | $26,082 | $136,789 |
| 2014 | $3,346 | $159,682 | $25,572 | $134,110 |
Source: Public Records
Map
Nearby Homes
- 3626 W Avenue J 2
- 44238 Encanto Way
- 44220 Encanto Way
- 44241 Tahoe Way
- 44451 63rd St W
- 44460 Encanto Way
- 6157 W Avenue j4
- 60 Stw Vic Ave
- 0 65th St West and J8 Unit 25002929
- 0 61st St W
- 6304 Starview Dr
- 60 W Avenue J-4
- 5818 W Avenue J
- 43815 Encanto Way
- 43869 Hampton St
- 44335 57th St W
- 6223 W Avenue j12
- 0 70th St West & Ave J10 Unit 25006970
- 67 Cor 67 Stw Kettering St Unit 21
- 0 Vic Avenue J12 67 Stw
- 44324 Freer Way
- 44312 Freer Way
- 44317 Encanto Way
- 44323 Encanto Way
- 44330 Freer Way
- 6343 W Avenue j2
- 6337 W Avenue j2
- 6343 W Ave J 2
- 44329 Encanto Way
- 44321 Freer Way
- 44315 Freer Way
- 6337 W Avenue J 2
- 44327 Freer Way
- 6331 W Avenue j2
- 44309 Freer Way
- 44310 Encanto Way
- 44333 Freer Way
- 6325 W Avenue j2
- 6345 Golding Dr
- 6339 Golding Dr
Your Personal Tour Guide
Ask me questions while you tour the home.