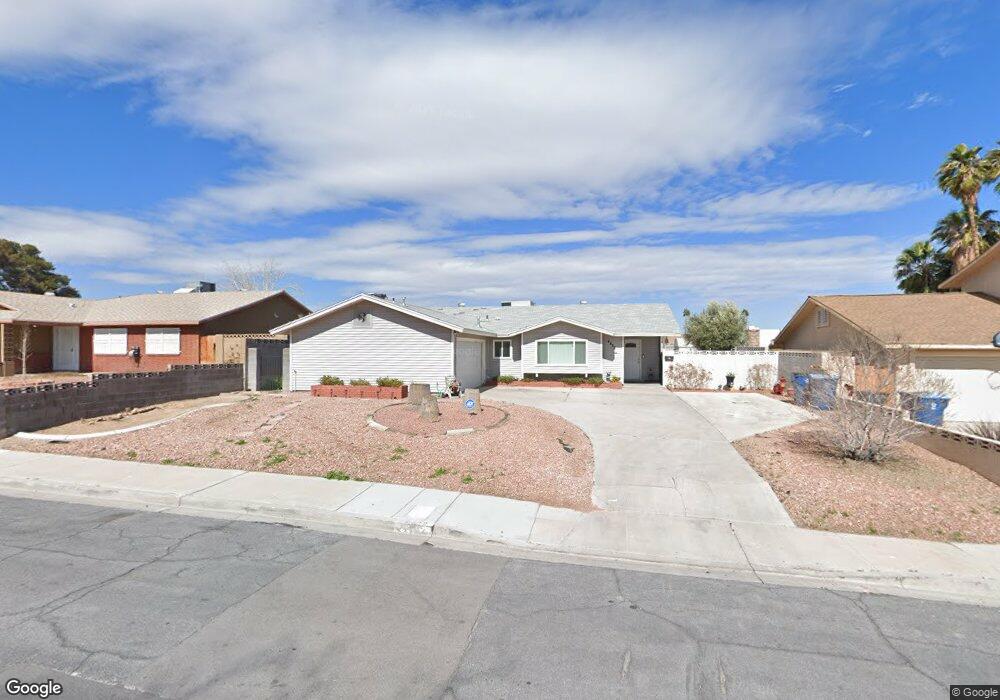
4432 El Como Way Las Vegas, NV 89121
Paradise Valley East NeighborhoodEstimated Value: $361,695 - $398,000
3
Beds
2
Baths
1,437
Sq Ft
$268/Sq Ft
Est. Value
About This Home
This home is located at 4432 El Como Way, Las Vegas, NV 89121 and is currently estimated at $385,424, approximately $268 per square foot. 4432 El Como Way is a home located in Clark County with nearby schools including J.M. Ullom Elementary School, C.W. Woodbury Middle School, and Chaparral High School.
Ownership History
Date
Name
Owned For
Owner Type
Purchase Details
Closed on
Oct 8, 2009
Sold by
Cueto Espinoza Luis F
Bought by
Forte Maria M Diaz
Current Estimated Value
Home Financials for this Owner
Home Financials are based on the most recent Mortgage that was taken out on this home.
Original Mortgage
$81,496
Outstanding Balance
$53,052
Interest Rate
5.02%
Mortgage Type
FHA
Estimated Equity
$332,372
Purchase Details
Closed on
Jul 29, 2009
Sold by
Johnson David
Bought by
Federal National Mortgage Association
Purchase Details
Closed on
Jul 12, 1995
Sold by
Schillinger Doris
Bought by
Johnson David
Home Financials for this Owner
Home Financials are based on the most recent Mortgage that was taken out on this home.
Original Mortgage
$96,370
Interest Rate
7.59%
Mortgage Type
FHA
Create a Home Valuation Report for This Property
The Home Valuation Report is an in-depth analysis detailing your home's value as well as a comparison with similar homes in the area
Home Values in the Area
Average Home Value in this Area
Purchase History
| Date | Buyer | Sale Price | Title Company |
|---|---|---|---|
| Forte Maria M Diaz | -- | Old Republic Title Company O | |
| Forte Maira M Diaz | $83,000 | Old Republic Title Company O | |
| Federal National Mortgage Association | $183,729 | None Available | |
| Johnson David | $98,000 | United Title |
Source: Public Records
Mortgage History
| Date | Status | Borrower | Loan Amount |
|---|---|---|---|
| Open | Forte Maira M Diaz | $81,496 | |
| Previous Owner | Johnson David | $96,370 |
Source: Public Records
Tax History Compared to Growth
Tax History
| Year | Tax Paid | Tax Assessment Tax Assessment Total Assessment is a certain percentage of the fair market value that is determined by local assessors to be the total taxable value of land and additions on the property. | Land | Improvement |
|---|---|---|---|---|
| 2025 | $760 | $48,919 | $28,000 | $20,919 |
| 2024 | $738 | $48,919 | $28,000 | $20,919 |
| 2023 | $565 | $52,179 | $32,200 | $19,979 |
| 2022 | $786 | $46,529 | $27,650 | $18,879 |
| 2021 | $728 | $43,021 | $24,500 | $18,521 |
| 2020 | $673 | $42,350 | $23,450 | $18,900 |
| 2019 | $631 | $39,440 | $20,300 | $19,140 |
| 2018 | $602 | $37,312 | $18,550 | $18,762 |
| 2017 | $1,062 | $36,211 | $16,800 | $19,411 |
| 2016 | $565 | $32,628 | $12,250 | $20,378 |
| 2015 | $562 | $31,037 | $10,500 | $20,537 |
| 2014 | $545 | $20,914 | $6,300 | $14,614 |
Source: Public Records
Map
Nearby Homes
- 4567 Dennis Way
- 4458 El Quinta Ct
- 4332 Del Santos Dr
- 4310 El Antonio Place
- 4457 Rita Dr
- 4285 El Como Way
- 4462 Newton Dr
- 4356 Powell Ave
- 4655 Bennett Dr
- 4606 Powell Ave
- 4845 S Mountain Vista St
- 4278 El Campana Way
- 4754 Marnell Dr
- 4269 Cartegena Way
- 4625 La Fonda Dr
- 4161 Oxnard Cir
- 4356 Sabadell St
- 4274 Gibraltar St
- 4345 Quay Ct Unit 5
- 4813 Plata Del Sol Dr
- 4444 El Como Way
- 4422 El Como Way
- 4421 El Cebra Way
- 4410 El Como Way
- 4454 El Como Way
- 4431 El Como Way
- 4453 El Cebra Way
- 4411 El Cebra Way
- 4421 El Como Way
- 4443 El Como Way
- 4464 El Como Way
- 4411 El Como Way
- 4453 El Como Way
- 4463 El Cebra Way
- 4432 El Cebra Way
- 4442 El Cebra Way
- 4420 El Cebra Way
- 4463 El Como Way
- 4434 Dennis Way
- 0 E El Cebra Way