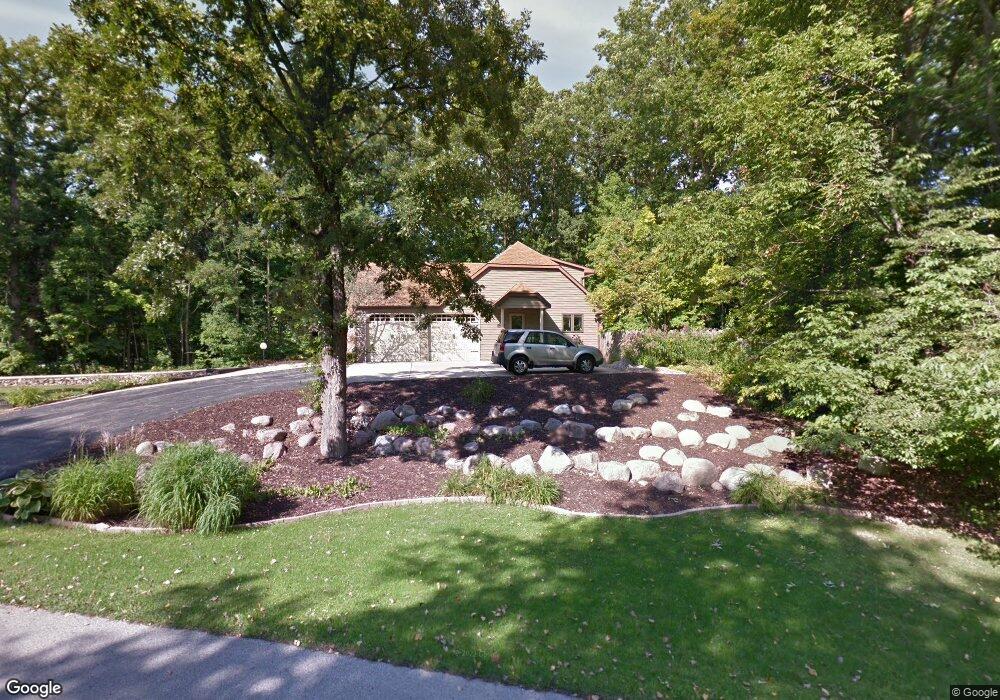
4432 Indian Trail Green Bay, WI 54313
Estimated Value: $559,000 - $589,000
5
Beds
5
Baths
4,074
Sq Ft
$140/Sq Ft
Est. Value
About This Home
This home is located at 4432 Indian Trail, Green Bay, WI 54313 and is currently estimated at $568,915, approximately $139 per square foot. 4432 Indian Trail is a home located in Brown County with nearby schools including Hillcrest Elementary School, Pulaski Community Middle School, and Pulaski High School.
Ownership History
Date
Name
Owned For
Owner Type
Purchase Details
Closed on
Jul 20, 2011
Sold by
Howland David L and Howland Christine M
Bought by
Krumrie Ryan D and Krumrie Ericka L
Current Estimated Value
Home Financials for this Owner
Home Financials are based on the most recent Mortgage that was taken out on this home.
Original Mortgage
$215,000
Outstanding Balance
$147,983
Interest Rate
4.52%
Mortgage Type
New Conventional
Estimated Equity
$420,932
Purchase Details
Closed on
Feb 27, 2002
Sold by
Thornton Michael J and Thornton Karen L
Bought by
Howland David L and Howland Christine M
Home Financials for this Owner
Home Financials are based on the most recent Mortgage that was taken out on this home.
Original Mortgage
$200,000
Interest Rate
5.5%
Purchase Details
Closed on
Jun 25, 1998
Sold by
Thornton Michael J and Thornton Karen L
Bought by
Thornton Living Trust
Create a Home Valuation Report for This Property
The Home Valuation Report is an in-depth analysis detailing your home's value as well as a comparison with similar homes in the area
Home Values in the Area
Average Home Value in this Area
Purchase History
| Date | Buyer | Sale Price | Title Company |
|---|---|---|---|
| Krumrie Ryan D | $230,000 | Liberty Title | |
| Howland David L | $274,000 | Bay Title & Abstract Inc | |
| Thornton Living Trust | -- | -- |
Source: Public Records
Mortgage History
| Date | Status | Borrower | Loan Amount |
|---|---|---|---|
| Open | Krumrie Ryan D | $215,000 | |
| Previous Owner | Howland David L | $200,000 |
Source: Public Records
Tax History Compared to Growth
Tax History
| Year | Tax Paid | Tax Assessment Tax Assessment Total Assessment is a certain percentage of the fair market value that is determined by local assessors to be the total taxable value of land and additions on the property. | Land | Improvement |
|---|---|---|---|---|
| 2024 | $4,913 | $304,700 | $61,800 | $242,900 |
| 2023 | $4,962 | $304,700 | $61,800 | $242,900 |
| 2022 | $4,261 | $304,700 | $61,800 | $242,900 |
| 2021 | $4,045 | $304,700 | $61,800 | $242,900 |
| 2020 | $4,590 | $260,000 | $55,500 | $204,500 |
| 2019 | $4,663 | $260,000 | $55,500 | $204,500 |
| 2018 | $4,645 | $260,000 | $55,500 | $204,500 |
| 2017 | $4,537 | $260,000 | $55,500 | $204,500 |
| 2016 | $4,569 | $260,000 | $55,500 | $204,500 |
| 2015 | $4,675 | $260,000 | $55,500 | $204,500 |
| 2014 | $6,209 | $260,000 | $55,500 | $204,500 |
| 2013 | $6,209 | $260,000 | $55,500 | $204,500 |
Source: Public Records
Map
Nearby Homes
- 4514 Mohawk Ct
- 4527 Choctaw Trail
- 4551 Choctaw Trail
- 1364 Lexington Ct
- 4600 Seminole Trail
- 541 Security Blvd
- 1232 Thayer Trail
- 692 Lincoln Ridge
- 652 Lincoln Ridge
- 3375 Shawano Ave
- 4327 Hilton Head Dr
- 4179 Hillcrest Dr
- 1274 S Sedona Cir
- 4354 Hilton Head Dr
- 1071 Hill Dr
- 4349 Windemer Ln
- 3442 Leeds Castle Dr
- 730 Pinecrest Rd
- 4367 Windemer Ln
- 997 Thornberry Creek Dr
- 4429 Indian Trail
- 4436 Wyandot Trail
- 4426 Indian Trail
- 4433 Wyandot Trail
- 4431 Seminole Trail
- 4442 Wyandot Trail
- 4400 Seminole Trail Unit BLOCK
- 4435 Indian Trail
- 1467 Wyandot Ct
- 4425 Indian Trail
- 4440 Indian Trail
- 4435 Seminole Trail
- 4444 Wyandot Trail
- 1461 Wyandot Ct
- 4441 Wyandot Trail
- 4448 Wyandot Trail
- 4511 Wyandot Trail
- 4515 Wyandot Trail
- 4447 Wyandot Trail
- 4443 Seminole Trail