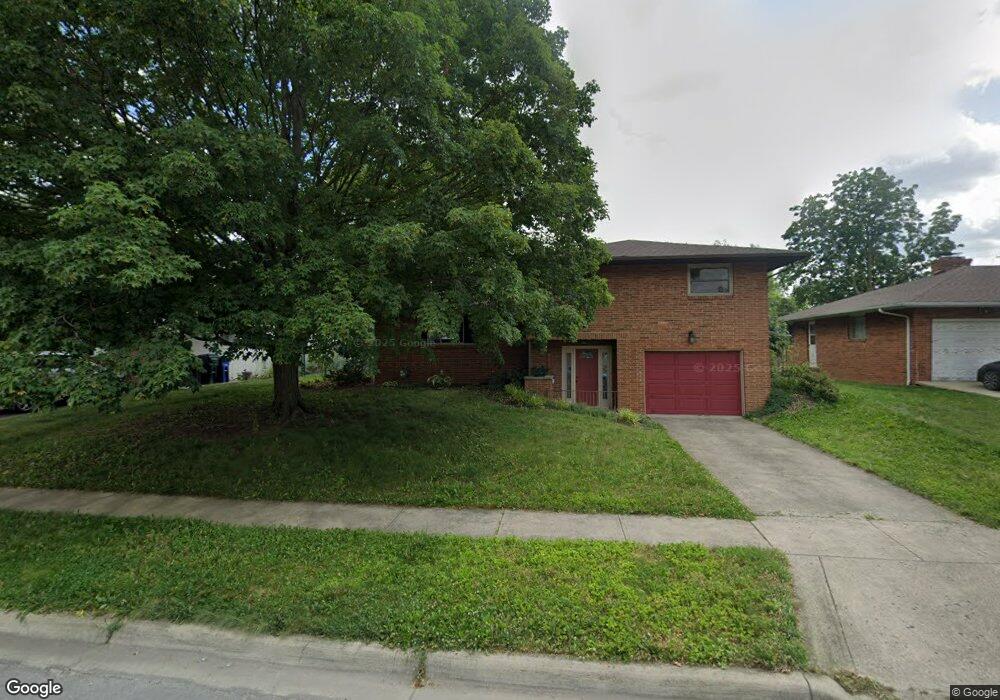
4432 Wetmore Rd E Columbus, OH 43224
Maize-Morse NeighborhoodEstimated Value: $254,138 - $308,000
3
Beds
2
Baths
1,365
Sq Ft
$214/Sq Ft
Est. Value
About This Home
This home is located at 4432 Wetmore Rd E, Columbus, OH 43224 and is currently estimated at $291,785, approximately $213 per square foot. 4432 Wetmore Rd E is a home located in Franklin County with nearby schools including Maize Road Elementary School, Medina Middle School, and Mifflin High School.
Ownership History
Date
Name
Owned For
Owner Type
Purchase Details
Closed on
Apr 25, 2018
Sold by
Kluth Ryan
Bought by
Ramey Diana
Current Estimated Value
Purchase Details
Closed on
Sep 30, 2009
Sold by
Barker Susan V and Chilli David A
Bought by
Kluth Ryan and Ramey Diana
Purchase Details
Closed on
Nov 27, 2006
Sold by
Chilli David A and Chilli Elsie A
Bought by
Barker Susan V
Purchase Details
Closed on
Feb 8, 2001
Sold by
Chilli David A and Chilli Elsie A
Bought by
Chilli David A and Chilli Elsie A
Purchase Details
Closed on
Jan 4, 1960
Bought by
Chilli David A and Chilli Elsie A
Create a Home Valuation Report for This Property
The Home Valuation Report is an in-depth analysis detailing your home's value as well as a comparison with similar homes in the area
Home Values in the Area
Average Home Value in this Area
Purchase History
| Date | Buyer | Sale Price | Title Company |
|---|---|---|---|
| Ramey Diana | $126,800 | None Available | |
| Kluth Ryan | $126,800 | Valmer Land | |
| Barker Susan V | $138,700 | Attorney | |
| Chilli David A | -- | -- | |
| Chilli David A | -- | -- |
Source: Public Records
Tax History
| Year | Tax Paid | Tax Assessment Tax Assessment Total Assessment is a certain percentage of the fair market value that is determined by local assessors to be the total taxable value of land and additions on the property. | Land | Improvement |
|---|---|---|---|---|
| 2025 | $3,615 | $80,540 | $19,670 | $60,870 |
| 2024 | $3,615 | $80,540 | $19,670 | $60,870 |
| 2023 | $3,568 | $80,540 | $19,670 | $60,870 |
| 2022 | $2,754 | $53,100 | $8,540 | $44,560 |
| 2021 | $2,759 | $53,100 | $8,540 | $44,560 |
| 2020 | $2,762 | $53,100 | $8,540 | $44,560 |
| 2019 | $2,582 | $42,570 | $6,830 | $35,740 |
| 2018 | $2,593 | $42,570 | $6,830 | $35,740 |
| 2017 | $2,581 | $42,570 | $6,830 | $35,740 |
| 2016 | $2,873 | $43,370 | $6,440 | $36,930 |
| 2015 | $2,608 | $43,370 | $6,440 | $36,930 |
| 2014 | $2,614 | $43,370 | $6,440 | $36,930 |
| 2013 | $1,358 | $45,675 | $6,790 | $38,885 |
Source: Public Records
Map
Nearby Homes
- 1144 Reed Circle Dr
- 1130 Carbone Dr
- 899 Meadowview Dr
- 827 Inwood Place
- 4605 Glenmawr Ave
- 4143 Karl Rd Unit 215
- 4143 Karl Rd Unit 314
- 4145 Karl Rd Unit 223
- 1116 Tulsa Dr
- 3941 Karl Rd Unit 326
- 3967 Karl Rd Unit 224
- 3939 Karl Rd Unit 311
- 4800 Bourke Rd
- 4795 Colonel Perry Dr
- 4983 Almont Dr
- 601 Morse Rd
- 991 Hidden Acres Ct Unit 991
- 1485 Norma Rd
- 4923 Karl Rd Unit 4925
- 435 E Beaumont Rd
- 4424 Wetmore Rd E
- 4440 Wetmore Rd E
- 4423 Maize Rd
- 4416 Wetmore Rd E
- 4448 Wetmore Rd E
- 4431 Maize Rd
- 4415 Maize Rd
- 4439 Maize Rd
- 4431 Wetmore Rd E
- 4407 Maize Rd
- 4423 Wetmore Rd E
- 4406 Wetmore Rd E
- 4449 Wetmore Rd E
- 4458 Wetmore Rd E
- 4447 Maize Rd
- 4415 Wetmore Rd E
- 4459 Wetmore Rd E
- 4398 Wetmore Rd E
- 4455 Maize Rd
- 4405 Wetmore Rd E
Your Personal Tour Guide
Ask me questions while you tour the home.