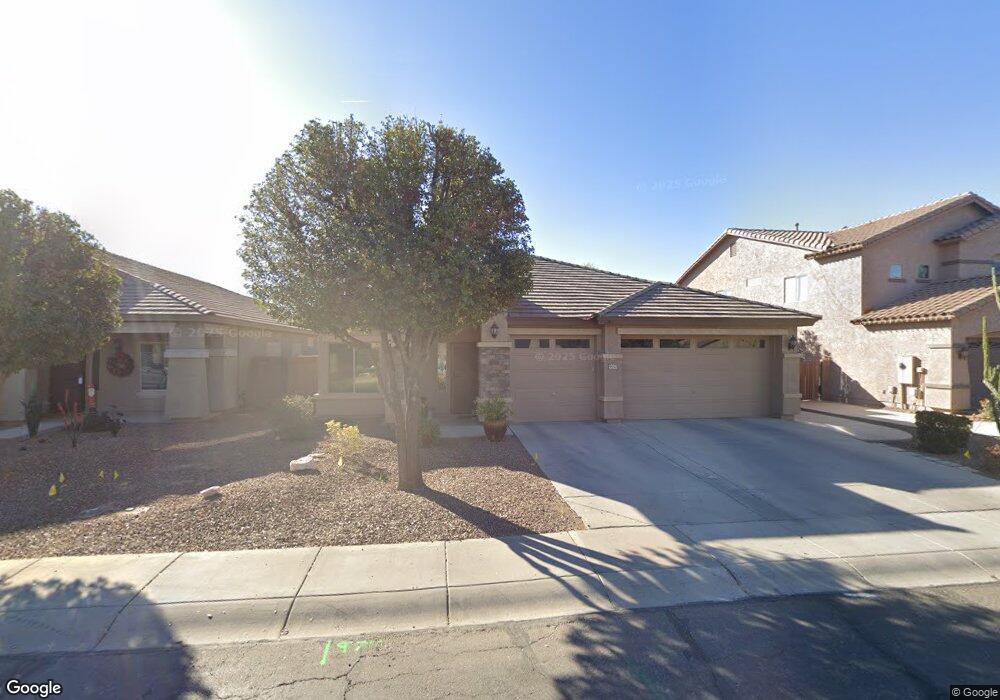
44325 W Adobe Cir Maricopa, AZ 85139
Estimated Value: $369,244 - $453,000
3
Beds
2
Baths
2,161
Sq Ft
$189/Sq Ft
Est. Value
About This Home
This home is located at 44325 W Adobe Cir, Maricopa, AZ 85139 and is currently estimated at $409,311, approximately $189 per square foot. 44325 W Adobe Cir is a home located in Pinal County with nearby schools including Pima Butte Elementary School, Maricopa High School, and Desert Wind Middle School.
Ownership History
Date
Name
Owned For
Owner Type
Purchase Details
Closed on
Apr 13, 2016
Sold by
Cruden Dennis Stuart and Cruden Susan Elizabeth
Bought by
Bellamy Jerry W and Bellamy Terrill K
Current Estimated Value
Home Financials for this Owner
Home Financials are based on the most recent Mortgage that was taken out on this home.
Original Mortgage
$184,000
Outstanding Balance
$146,416
Interest Rate
3.73%
Mortgage Type
New Conventional
Estimated Equity
$262,895
Purchase Details
Closed on
Apr 12, 2013
Sold by
Cruden Dennis S and Cruden Susan E
Bought by
Cruden Dennis Stuart and Cruden Susan Elizabeth
Purchase Details
Closed on
Mar 29, 2005
Sold by
Fulton Homes Sales Corp
Bought by
Cruden Dennis S and Cruden Susan E
Home Financials for this Owner
Home Financials are based on the most recent Mortgage that was taken out on this home.
Original Mortgage
$174,200
Interest Rate
5.6%
Mortgage Type
New Conventional
Create a Home Valuation Report for This Property
The Home Valuation Report is an in-depth analysis detailing your home's value as well as a comparison with similar homes in the area
Home Values in the Area
Average Home Value in this Area
Purchase History
| Date | Buyer | Sale Price | Title Company |
|---|---|---|---|
| Bellamy Jerry W | $230,000 | None Available | |
| Cruden Dennis Stuart | -- | None Available | |
| Cruden Dennis S | $235,053 | -- | |
| Fulton Homes Sales Corp | $184,066 | -- |
Source: Public Records
Mortgage History
| Date | Status | Borrower | Loan Amount |
|---|---|---|---|
| Open | Bellamy Jerry W | $184,000 | |
| Previous Owner | Cruden Dennis S | $174,200 | |
| Closed | Cruden Dennis S | $35,300 |
Source: Public Records
Tax History Compared to Growth
Tax History
| Year | Tax Paid | Tax Assessment Tax Assessment Total Assessment is a certain percentage of the fair market value that is determined by local assessors to be the total taxable value of land and additions on the property. | Land | Improvement |
|---|---|---|---|---|
| 2025 | $2,106 | $29,242 | -- | -- |
| 2024 | $1,993 | $36,046 | -- | -- |
| 2023 | $2,051 | $23,720 | $2,222 | $21,498 |
| 2022 | $1,993 | $18,953 | $2,222 | $16,731 |
| 2021 | $1,902 | $17,362 | $0 | $0 |
| 2020 | $1,816 | $17,196 | $0 | $0 |
| 2019 | $1,746 | $15,135 | $0 | $0 |
| 2018 | $1,723 | $14,152 | $0 | $0 |
| 2017 | $1,642 | $13,659 | $0 | $0 |
| 2016 | $1,478 | $13,943 | $1,250 | $12,693 |
| 2014 | -- | $9,064 | $1,000 | $8,064 |
Source: Public Records
Map
Nearby Homes
- 44254 W Adobe Cir
- 44092 W Stonecreek Rd
- 44561 W Garden Ln
- 43930 W Stonecreek Rd
- 43916 Stonecreek Rd
- 43862 W Scenic Dr
- 44566 W High Desert Trail
- 44574 W High Desert Trail
- 22348 N Braden Rd
- 44517 W Copper Trail
- 44538 W Canyon Creek Dr
- 43572 W Sunland Dr
- 43813 W Rio Lobo Dr
- 44158 W Canyon Creek Dr
- 21928 N Braden Rd
- 43822 W Baker Dr
- 43648 W Chambers Ct
- 43292 W Oakland Ct
- 43319 W Oakland Ct
- 21719 N Celtic Ave
- 44307 W Adobe Cir
- 44343 W Adobe Cir
- 44361 W Adobe Cir
- 44289 W Adobe Cir
- 44326 W Adobe Cir
- 44379 W Adobe Cir
- 44271 W Adobe Cir
- 44344 W Adobe Cir
- 44308 W Adobe Cir
- 44362 W Adobe Cir
- 44290 W Adobe Cir
- 44399 W Adobe Cir
- 44380 W Adobe Cir
- 44272 W Adobe Cir
- 44400 W Adobe Cir
- 44417 W Adobe Cir
- 22121 N Cobblestone Farms Dr
- 44225 W Adobe Cir
- 44418 W Adobe Cir
- 44236 W Adobe Cir