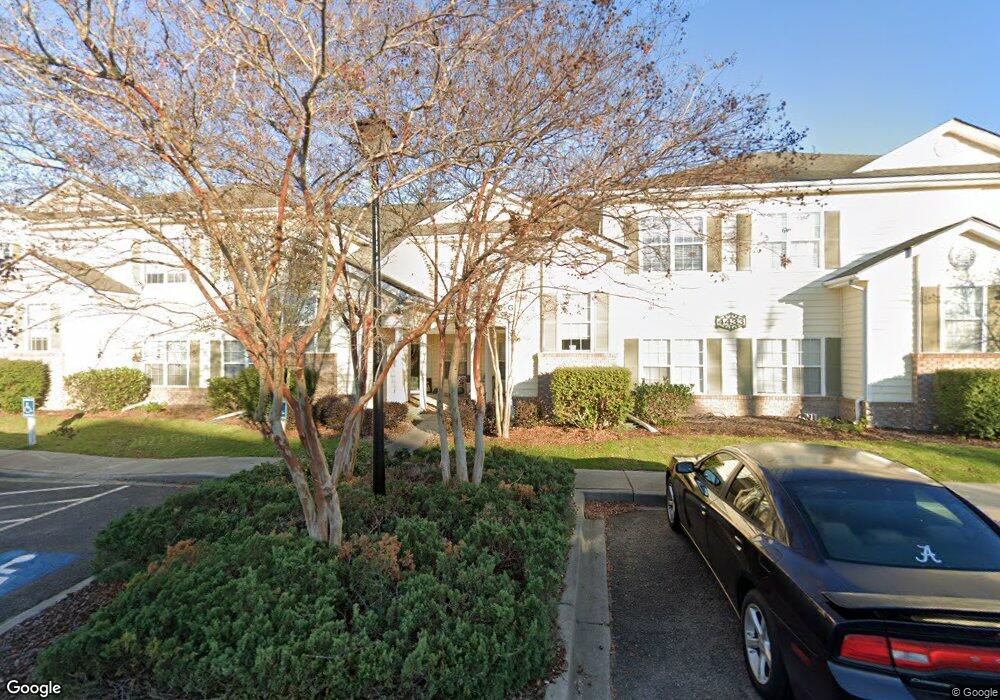
4433 Montrose Ln Unit 4433B Myrtle Beach, SC 29579
Estimated Value: $227,000 - $233,000
2
Beds
2
Baths
1,279
Sq Ft
$179/Sq Ft
Est. Value
About This Home
This home is located at 4433 Montrose Ln Unit 4433B, Myrtle Beach, SC 29579 and is currently estimated at $229,302, approximately $179 per square foot. 4433 Montrose Ln Unit 4433B is a home located in Horry County with nearby schools including River Oaks Elementary School, Ten Oaks Middle, and Carolina Forest High School.
Ownership History
Date
Name
Owned For
Owner Type
Purchase Details
Closed on
Jul 21, 2023
Sold by
Vargeson Gerald C
Bought by
Gilbert Michael A
Current Estimated Value
Purchase Details
Closed on
Feb 16, 2018
Sold by
Staats Karen M
Bought by
Vargeson Gerald C and Vargeson Carol A
Purchase Details
Closed on
Oct 17, 2017
Sold by
Olinder Holdings Llc
Bought by
Staats Karen M
Purchase Details
Closed on
Feb 25, 2013
Sold by
Malizia Olindo A
Bought by
Olinder Holdings Llc
Purchase Details
Closed on
Mar 29, 2006
Sold by
Ldy Properties Llc
Bought by
Gleneagles Iii Llc
Purchase Details
Closed on
Jul 16, 2001
Sold by
Gleneagles Ltd
Bought by
Malizia Olindo A and Malizia Henrietta M
Home Financials for this Owner
Home Financials are based on the most recent Mortgage that was taken out on this home.
Original Mortgage
$16,090
Interest Rate
7.08%
Mortgage Type
Stand Alone Second
Create a Home Valuation Report for This Property
The Home Valuation Report is an in-depth analysis detailing your home's value as well as a comparison with similar homes in the area
Home Values in the Area
Average Home Value in this Area
Purchase History
| Date | Buyer | Sale Price | Title Company |
|---|---|---|---|
| Gilbert Michael A | $239,900 | -- | |
| Vargeson Gerald C | $128,000 | -- | |
| Staats Karen M | $107,000 | -- | |
| Olinder Holdings Llc | -- | -- | |
| Gleneagles Iii Llc | $214,400 | None Available | |
| Malizia Olindo A | $160,900 | -- |
Source: Public Records
Mortgage History
| Date | Status | Borrower | Loan Amount |
|---|---|---|---|
| Previous Owner | Malizia Olindo A | $16,090 | |
| Previous Owner | Malizia Olindo A | $128,720 |
Source: Public Records
Tax History Compared to Growth
Tax History
| Year | Tax Paid | Tax Assessment Tax Assessment Total Assessment is a certain percentage of the fair market value that is determined by local assessors to be the total taxable value of land and additions on the property. | Land | Improvement |
|---|---|---|---|---|
| 2024 | $1,054 | $9,200 | $0 | $9,200 |
| 2023 | $1,054 | $13,020 | $0 | $13,020 |
| 2021 | $369 | $13,020 | $0 | $13,020 |
| 2020 | $302 | $13,020 | $0 | $13,020 |
| 2019 | $476 | $13,020 | $0 | $13,020 |
| 2018 | $0 | $13,125 | $0 | $13,125 |
| 2017 | $0 | $9,135 | $0 | $9,135 |
| 2016 | -- | $5,220 | $0 | $5,220 |
| 2015 | $1,140 | $9,135 | $0 | $9,135 |
| 2014 | $1,102 | $5,220 | $0 | $5,220 |
Source: Public Records
Map
Nearby Homes
- 4432 Montrose Ln Unit H
- 4430 Montrose Ln Unit G
- 5306 Abbey Park Loop
- 4499 Girvan Dr Unit H
- 4508 Ailsa Ct Unit 4508-E
- 2000 Kilkee Dr
- 4541 Girvan Dr Unit B
- 4254 Congressional Dr
- 4036 Girvan Dr
- 4574 Girvan Dr Unit D
- 305 Boone Trail Unit MB
- 264 Carolina Lakes Blvd
- 104 Sprucewood Ct
- 4591 Girvan Dr Unit F
- 4603 Arran Ct Unit C
- 4000 Girvan Dr
- 4608 Arran Ct Unit 7-D
- 257 Augusta Green Way
- 4389 Parkland Dr
- 4363 Parkland Dr
- 4433G Montrose Ln Unit 4433G
- 4433F Montrose Ln Unit 4433F
- 4433C Montrose Ln Unit 4433C
- 4433 Montrose Ln Unit 4433-C
- 4433 Montrose Ln
- 4433H Montrose Ln Unit 4433H
- 4433D Montrose Ln Unit 4433D
- 4433 Montrose Ln Unit 4433A
- 4433 Montrose Ln Unit F
- 4433 Montrose Ln Unit E
- 4433 Montrose Ln Unit C
- 4433 Montrose Ln Unit 4433G
- 4433 Montrose Ln Unit 4433H
- 4433 Montrose Ln Unit B
- 4433 Montrose Ln Unit F
- 4433 A Montrose Ln
- 4433 A Montrose Ln Unit A
- 4435E Montrose Ln Unit 4435E
- 4435D Montrose Ln Unit 4435D
- 4435 Montrose Ln Unit 4435B