4435 21st Ct SE Lacey, WA 98503
Central Lacey NeighborhoodEstimated payment $2,788/month
Highlights
- Property is near public transit
- Double Oven
- Walk-In Closet
- No HOA
- Storm Windows
- Bathroom on Main Level
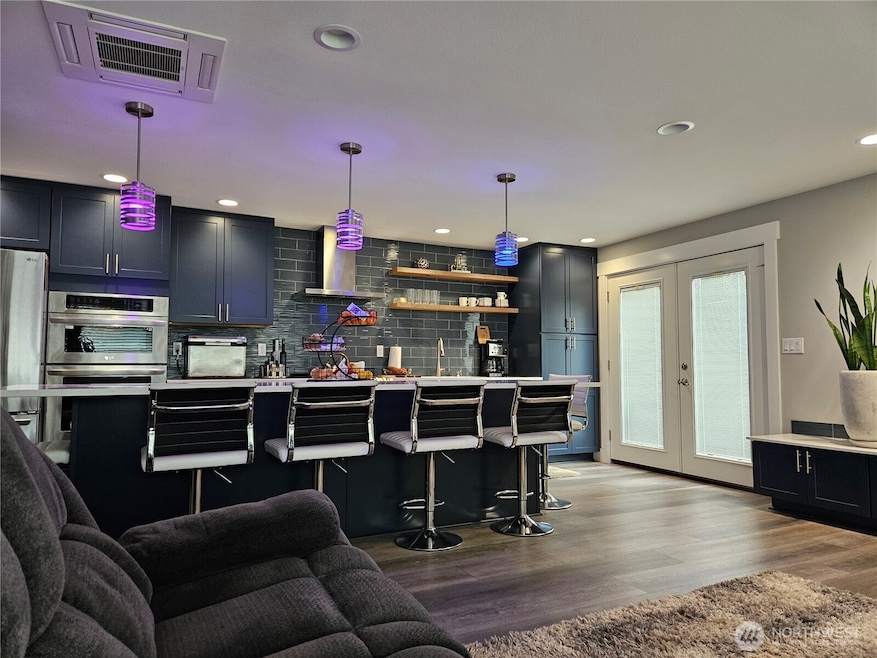
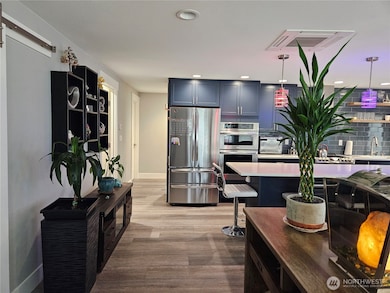
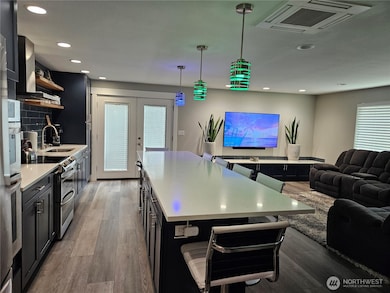
About This Home
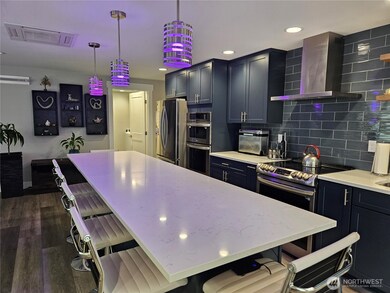
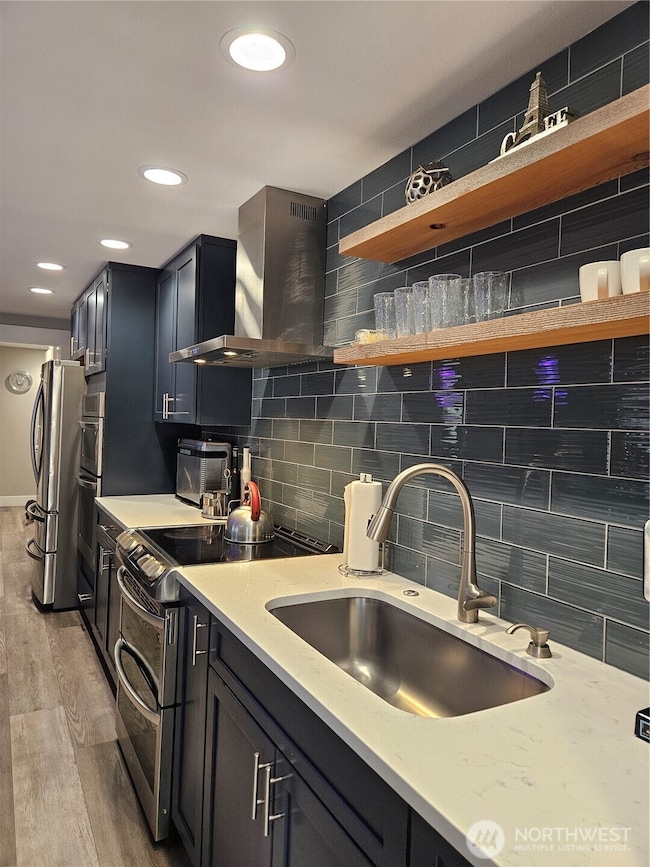
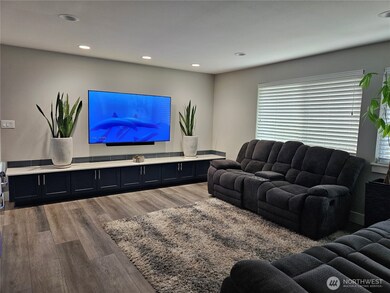
Welcome home to this beautifully maintained 3-bedroom, 2-bath residence with additional, office/ bonus room, perfectly tucked away on a quiet cul-de-sac. Enjoy generous garden space for planting, relaxing, or hosting backyard BBQs. Step inside to an inviting open-concept layout featuring an impressive 11-foot kitchen island, stainless steel appliances, a double oven plus range with oven, and elegant quartz countertops in both the kitchen and bathrooms. This one-story home offers comfort year-round with A/C for hot summers and a ductless heat pump to keep you cozy in winter. Garden shed, and RV parking. Located near parks, schools, shopping, hospitals, medical facilities.
Source: Northwest Multiple Listing Service (NWMLS)
MLS#: 2456033
Home Details
Home Type
- Single Family
Est. Annual Taxes
- $3,759
Year Built
- Built in 1967
Lot Details
- 0.27 Acre Lot
- 4335-00-00500
- Property is in good condition
Parking
- Off-Street Parking
Home Design
- Poured Concrete
- Composition Roof
- Wood Siding
- Wood Composite
Interior Spaces
- 1,360 Sq Ft Home
- 1-Story Property
- Ceiling Fan
- Storm Windows
Kitchen
- Double Oven
- Stove
- Microwave
- Dishwasher
- Disposal
Flooring
- Carpet
- Laminate
Bedrooms and Bathrooms
- 3 Main Level Bedrooms
- Walk-In Closet
- Bathroom on Main Level
- 2 Full Bathrooms
Laundry
- Dryer
- Washer
Location
- Property is near public transit
- Property is near a bus stop
Utilities
- Ductless Heating Or Cooling System
- Baseboard Heating
- Generator Hookup
- Water Heater
Community Details
- No Home Owners Association
- Lacey Subdivision
Listing and Financial Details
- Down Payment Assistance Available
- Visit Down Payment Resource Website
- Assessor Parcel Number 43350000500
Map
Home Values in the Area
Average Home Value in this Area
Tax History
| Year | Tax Paid | Tax Assessment Tax Assessment Total Assessment is a certain percentage of the fair market value that is determined by local assessors to be the total taxable value of land and additions on the property. | Land | Improvement |
|---|---|---|---|---|
| 2024 | $3,219 | $361,600 | $148,600 | $213,000 |
| 2023 | $3,219 | $336,400 | $138,400 | $198,000 |
| 2022 | $2,842 | $323,800 | $105,800 | $218,000 |
| 2021 | $2,558 | $244,000 | $102,200 | $141,800 |
| 2020 | $2,126 | $204,500 | $98,100 | $106,400 |
| 2019 | $1,823 | $176,500 | $67,300 | $109,200 |
| 2018 | $2,047 | $152,300 | $50,000 | $102,300 |
| 2017 | $1,818 | $135,400 | $40,900 | $94,500 |
| 2016 | $1,659 | $131,650 | $48,450 | $83,200 |
| 2014 | -- | $126,650 | $48,450 | $78,200 |
Property History
| Date | Event | Price | List to Sale | Price per Sq Ft |
|---|---|---|---|---|
| 11/30/2025 11/30/25 | For Sale | $470,000 | -- | $346 / Sq Ft |
Purchase History
| Date | Type | Sale Price | Title Company |
|---|---|---|---|
| Interfamily Deed Transfer | -- | Amrock Llc | |
| Quit Claim Deed | -- | None Available | |
| Warranty Deed | $151,719 | Stewart Title Western Wa Inc |
Mortgage History
| Date | Status | Loan Amount | Loan Type |
|---|---|---|---|
| Open | $308,000 | New Conventional | |
| Previous Owner | $157,016 | VA |
Source: Northwest Multiple Listing Service (NWMLS)
MLS Number: 2456033
APN: 43350000500
Disclaimer: Certain information contained herein is derived from information provided by parties other than Homes.com. All information provided is deemed reliable, but is not guaranteed to be accurate and should be independently verified.
![]() All data is obtained from various sources and may not have been verified by broker or MLS GRID. Supplied Open House Information is subject to change without notice. All information should be independently reviewed and verified for accuracy. Properties may or may not be listed by the office/agent presenting the information. Listing information is provided by the Northwest Multiple Listing Service (NWMLS). Property information is based on available data that may include MLS information, county records, and other sources. Listings marked with the 3 tree icon and provided by NWMLS. All properties are subject to prior sale or withdrawal. IDX information is provided exclusively for consumers’ personal noncommercial use, that it may not be used for any purpose other than to identify prospective properties consumers may be interested in purchasing, that the data is deemed reliable but is not guaranteed by MLS GRID. ©2025 NWMLS.
All data is obtained from various sources and may not have been verified by broker or MLS GRID. Supplied Open House Information is subject to change without notice. All information should be independently reviewed and verified for accuracy. Properties may or may not be listed by the office/agent presenting the information. Listing information is provided by the Northwest Multiple Listing Service (NWMLS). Property information is based on available data that may include MLS information, county records, and other sources. Listings marked with the 3 tree icon and provided by NWMLS. All properties are subject to prior sale or withdrawal. IDX information is provided exclusively for consumers’ personal noncommercial use, that it may not be used for any purpose other than to identify prospective properties consumers may be interested in purchasing, that the data is deemed reliable but is not guaranteed by MLS GRID. ©2025 NWMLS.
Based on information submitted to the MLS GRID
- 2209 Golf Club Rd SE
- 4802 19th Ave SE
- 4537 14th Way SE
- 4911 20th Ave SE
- 4613 26th Ave SE
- 2617 College St SE
- 4709 14th Ave SE
- 4612 14th Ave SE
- 1316 13th Ct SE
- 1220 Golf Club Rd SE
- 1413 Alder St SE
- 1409 Alder St SE
- 1405 Josephine Ct SE
- 1503 Dogwood St SE
- 6729 Dusty Ln SE
- 5412 Melody Dr SE
- 1201 East St SE
- 3504 Meadowbrook Ln SE
- 3516 Meadowbrook Ln SE
- 0 12th Ave SE Unit NWM2387380
- 2617 Cedar Hills Ct SE
- 3800 14th Ave SE
- 3301 College St SE
- 629 Woodland Square Loop SE
- 3806 12th Ave SE
- 2928 Ruddell Rd SE
- 3725 Wildspitz Ln SE
- 1400 Fones Rd SE
- 4712 Kapalea Way SE
- 1410 Alanna Dr SE
- 1700 Kempton St SE
- 6205 Pacific Ave SE
- 512 Franz Anderson Rd SE
- 3335 Martin Way E
- 3724 Ensign Rd NE
- 5001 College St SE
- 3800 Ensign Rd NE
- 4538 Wiggins Rd SE
- 5011 Kenrick St SE
- 1012 Burr Rd SE
