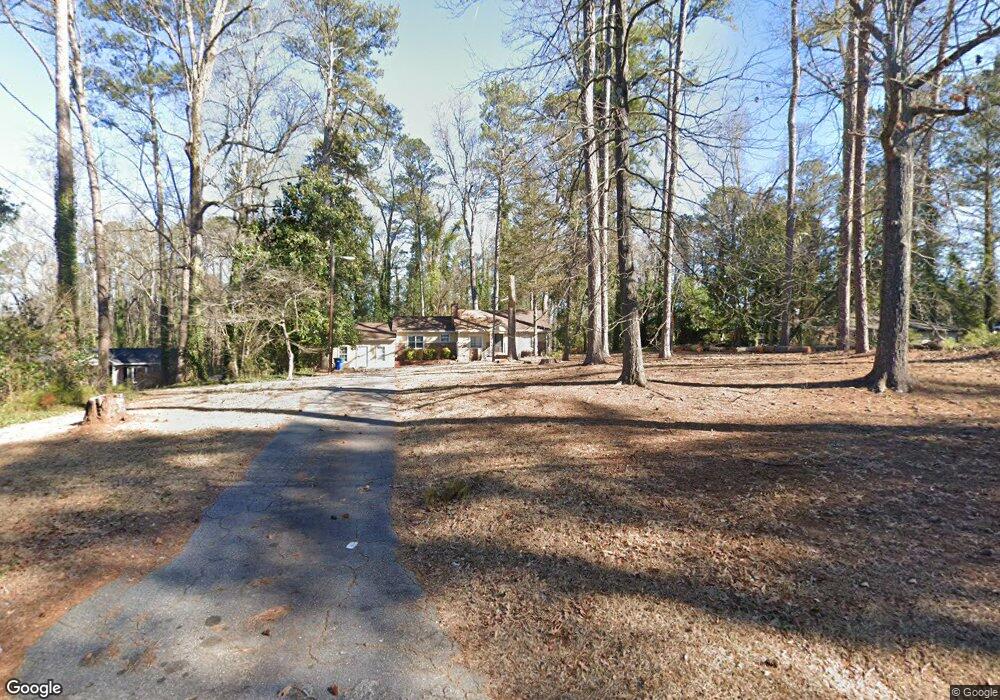
4435 Cascade Rd SW Atlanta, GA 30331
Estimated Value: $207,000 - $306,000
3
Beds
2
Baths
1,313
Sq Ft
$190/Sq Ft
Est. Value
About This Home
This home is located at 4435 Cascade Rd SW, Atlanta, GA 30331 and is currently estimated at $249,238, approximately $189 per square foot. 4435 Cascade Rd SW is a home located in Fulton County with nearby schools including The Kindezi School West and OMNI International School.
Ownership History
Date
Name
Owned For
Owner Type
Purchase Details
Closed on
Jul 1, 2015
Sold by
Cullen Peter
Bought by
Brown Sherrod
Current Estimated Value
Purchase Details
Closed on
Aug 3, 2011
Sold by
Brown Sherrod
Bought by
Cullen Peter
Purchase Details
Closed on
Jan 12, 2001
Sold by
Douglas James R
Bought by
Brown Sherod
Home Financials for this Owner
Home Financials are based on the most recent Mortgage that was taken out on this home.
Original Mortgage
$126,350
Interest Rate
7.44%
Mortgage Type
New Conventional
Purchase Details
Closed on
Jan 11, 2000
Sold by
Residential Funding Corp
Bought by
Douglas James R
Home Financials for this Owner
Home Financials are based on the most recent Mortgage that was taken out on this home.
Original Mortgage
$96,500
Interest Rate
7.87%
Mortgage Type
New Conventional
Purchase Details
Closed on
Jul 6, 1999
Sold by
Reese Jeanette B
Bought by
Residential Funding Corp
Create a Home Valuation Report for This Property
The Home Valuation Report is an in-depth analysis detailing your home's value as well as a comparison with similar homes in the area
Home Values in the Area
Average Home Value in this Area
Purchase History
| Date | Buyer | Sale Price | Title Company |
|---|---|---|---|
| Brown Sherrod | $40,000 | -- | |
| Cullen Peter | $19,900 | -- | |
| Brown Sherod | $133,000 | -- | |
| Douglas James R | $70,200 | -- | |
| Residential Funding Corp | $71,001 | -- |
Source: Public Records
Mortgage History
| Date | Status | Borrower | Loan Amount |
|---|---|---|---|
| Previous Owner | Brown Sherod | $126,350 | |
| Previous Owner | Douglas James R | $96,500 |
Source: Public Records
Tax History Compared to Growth
Tax History
| Year | Tax Paid | Tax Assessment Tax Assessment Total Assessment is a certain percentage of the fair market value that is determined by local assessors to be the total taxable value of land and additions on the property. | Land | Improvement |
|---|---|---|---|---|
| 2025 | $292 | $35,120 | $9,200 | $25,920 |
| 2023 | $292 | $35,200 | $9,200 | $26,000 |
| 2022 | $278 | $35,200 | $9,200 | $26,000 |
| 2021 | $274 | $34,160 | $8,920 | $25,240 |
| 2020 | $274 | $33,760 | $8,800 | $24,960 |
| 2019 | $306 | $33,200 | $8,680 | $24,520 |
| 2018 | $575 | $32,360 | $8,440 | $23,920 |
| 2017 | $652 | $16,000 | $4,160 | $11,840 |
| 2016 | $652 | $16,000 | $4,160 | $11,840 |
| 2015 | $1,709 | $41,800 | $13,480 | $28,320 |
| 2014 | $1,580 | $36,640 | $13,480 | $23,160 |
Source: Public Records
Map
Nearby Homes
- 0 Wilson Mill
- 0 Wilson Mill Rd SW Unit 7606099
- 670 Timbergrove Dr SW
- 145 Shadybrook Ln SW
- 1155 Apollo Dr SW
- 4240 Cascade Rd SW
- 930 New Hope Rd SW
- 1055 Elysian Park SW
- 403 Dollar Mill Rd SW
- 4181 Danforth Rd SW
- 4250 Utoy Ct SW
- 4525 Boulder Park Dr SW
- 1105 New Britain Dr SW
- 220 Milano Dr SW
- 4325 Boulder Park Dr SW
- 688 Plainville Dr SW
- 4400 Celebration Dr SW
- 4025 Cascade Rd SW
- 645 Plainville Dr SW
- 4441 Cascade Rd SW
- 4449 Cascade Rd SW
- 1315 Regency Center Dr SW
- 210 Straton Trace SW Unit IV
- 720 Garr Cir SW
- 1330 Regency Center Dr SW
- 4485 Cascade Rd SW
- 200 Straton Trace SW
- 220 Straton Trace SW
- 1320 Regency Center Dr SW
- 750 Garr Cir SW
- 0 Garr Cir SW Unit 7370465
- 0 Garr Cir SW
- 700 Garr Cir SW
- 4375 Cascade Rd SW
- 230 Straton Trace SW Unit 4
- 1310 Regency Center Dr SW
- 205 Straton Trace SW
- 705 Garr Cir SW
- 4380 Cascade Rd SW