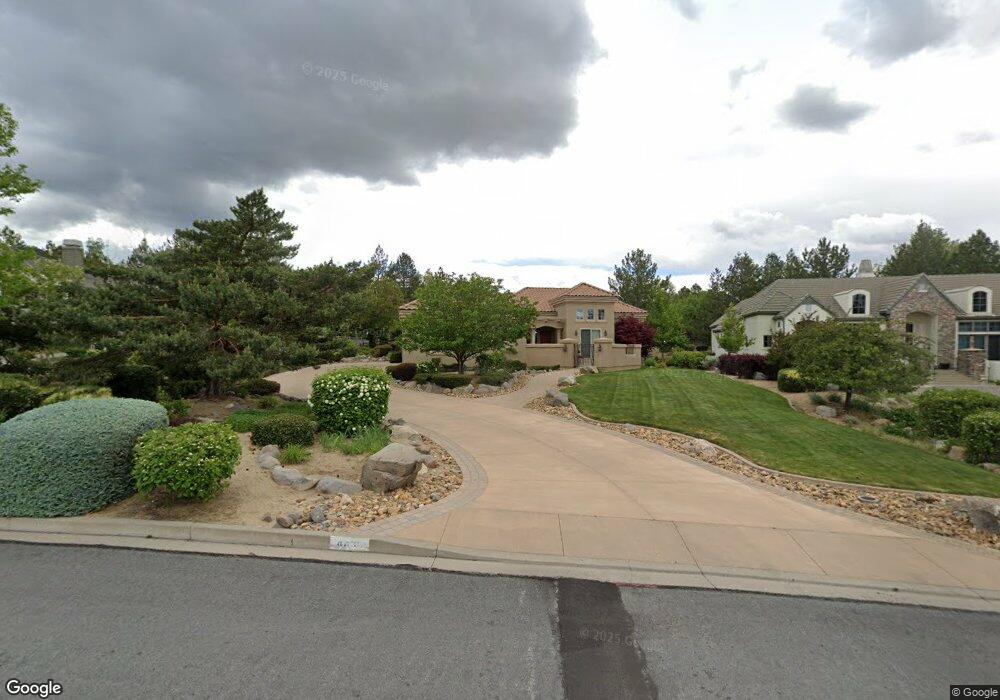
4435 Juniper Trail Reno, NV 89519
South Outer Reno NeighborhoodEstimated Value: $1,148,000 - $1,718,000
3
Beds
3
Baths
3,201
Sq Ft
$446/Sq Ft
Est. Value
About This Home
This home is located at 4435 Juniper Trail, Reno, NV 89519 and is currently estimated at $1,427,337, approximately $445 per square foot. 4435 Juniper Trail is a home located in Washoe County with nearby schools including Roy Gomm Elementary School, Darrell C Swope Middle School, and Reno High School.
Ownership History
Date
Name
Owned For
Owner Type
Purchase Details
Closed on
Sep 9, 2014
Sold by
West Christopher and West Laurie
Bought by
West Christopher
Current Estimated Value
Home Financials for this Owner
Home Financials are based on the most recent Mortgage that was taken out on this home.
Original Mortgage
$220,000
Outstanding Balance
$163,610
Interest Rate
3.62%
Mortgage Type
Adjustable Rate Mortgage/ARM
Estimated Equity
$1,263,727
Purchase Details
Closed on
Dec 23, 2003
Sold by
West Christopher J and West Laurie Ann
Bought by
West Christopher J and West Laurie Ann
Home Financials for this Owner
Home Financials are based on the most recent Mortgage that was taken out on this home.
Original Mortgage
$161,975
Interest Rate
6.03%
Mortgage Type
New Conventional
Purchase Details
Closed on
Nov 2, 1999
Sold by
West Christopher and West Laurie
Bought by
West Christopher J and West Laurie Ann
Purchase Details
Closed on
Mar 13, 1995
Sold by
Lands Of Sierra Inc
Bought by
West Christopher and West Laurie
Create a Home Valuation Report for This Property
The Home Valuation Report is an in-depth analysis detailing your home's value as well as a comparison with similar homes in the area
Home Values in the Area
Average Home Value in this Area
Purchase History
| Date | Buyer | Sale Price | Title Company |
|---|---|---|---|
| West Christopher | -- | Fidelity Title | |
| West Christopher J | -- | Western Title Incorporated | |
| West Christopher J | -- | -- | |
| West Christopher | $77,000 | First American Title Company |
Source: Public Records
Mortgage History
| Date | Status | Borrower | Loan Amount |
|---|---|---|---|
| Open | West Christopher | $220,000 | |
| Closed | West Christopher J | $161,975 |
Source: Public Records
Tax History
| Year | Tax Paid | Tax Assessment Tax Assessment Total Assessment is a certain percentage of the fair market value that is determined by local assessors to be the total taxable value of land and additions on the property. | Land | Improvement |
|---|---|---|---|---|
| 2026 | $6,194 | $306,943 | $131,250 | $175,693 |
| 2024 | $8,029 | $293,167 | $112,000 | $181,167 |
| 2023 | $7,801 | $276,528 | $105,000 | $171,528 |
| 2022 | $7,574 | $236,376 | $92,750 | $143,626 |
| 2021 | $7,349 | $222,259 | $78,750 | $143,509 |
| 2020 | $7,133 | $222,956 | $78,750 | $144,206 |
| 2019 | $6,934 | $210,048 | $70,000 | $140,048 |
| 2018 | $6,724 | $207,710 | $70,000 | $137,710 |
| 2017 | $6,529 | $208,471 | $70,000 | $138,471 |
| 2016 | $6,363 | $205,079 | $64,750 | $140,329 |
| 2015 | $1,595 | $180,513 | $39,235 | $141,278 |
| 2014 | $6,169 | $168,231 | $30,450 | $137,781 |
| 2013 | -- | $165,533 | $30,450 | $135,083 |
Source: Public Records
Map
Nearby Homes
- 7440 W 4th St Unit 7
- 7440 W 4th St Unit 73
- 7440 W 4th St Unit 45
- 7440 W 4th St Unit 46
- 0 Woodchuck Cir Unit 41-051-24
- 265 Anselmo Dr
- 4930 Woodchuck Cir Unit 4
- 4890 Woodchuck Cir Unit 3
- 4820 Woodchuck Cir Unit 2
- 4760 Woodchuck Cir Unit 1
- 4895 Woodchuck Cir Unit 16
- 4825 Woodchuck Cir Unit 17
- 4840 Keshmiri Place
- 4055 Plateau Rd
- 5045 Hunters Peak Rd Unit 13
- 4260 Longknife Rd
- 4387 Sharps Rd
- 6850 Sharlands Ave Unit 2039
- 6850 Sharlands Ave Unit U2123
- 6850 Sharlands Ave Unit f2026
- 4445 Juniper Trail
- 4425 Juniper Trail Unit 1
- 4455 Juniper Trail
- 621 Meadowgate Ct
- 4415 Juniper Trail
- 4440 Juniper Trail
- 640 Meadowgate Ct
- 4450 Juniper Trail Unit 2
- 4625 Mountaingate Dr
- 4405 Juniper Trail
- 4410 Juniper Trail
- 4465 Juniper Trail
- 4405 Starwood Ct Unit 1
- 4304 Meadowgate Trail
- 4615 Mountaingate Dr
- 620 Meadowgate Ct Unit 3
- 601 Meadowgate Ct
- 4395 Juniper Trail
- 4400 Juniper Trail Unit 149
- 4400 Juniper Trail
Your Personal Tour Guide
Ask me questions while you tour the home.