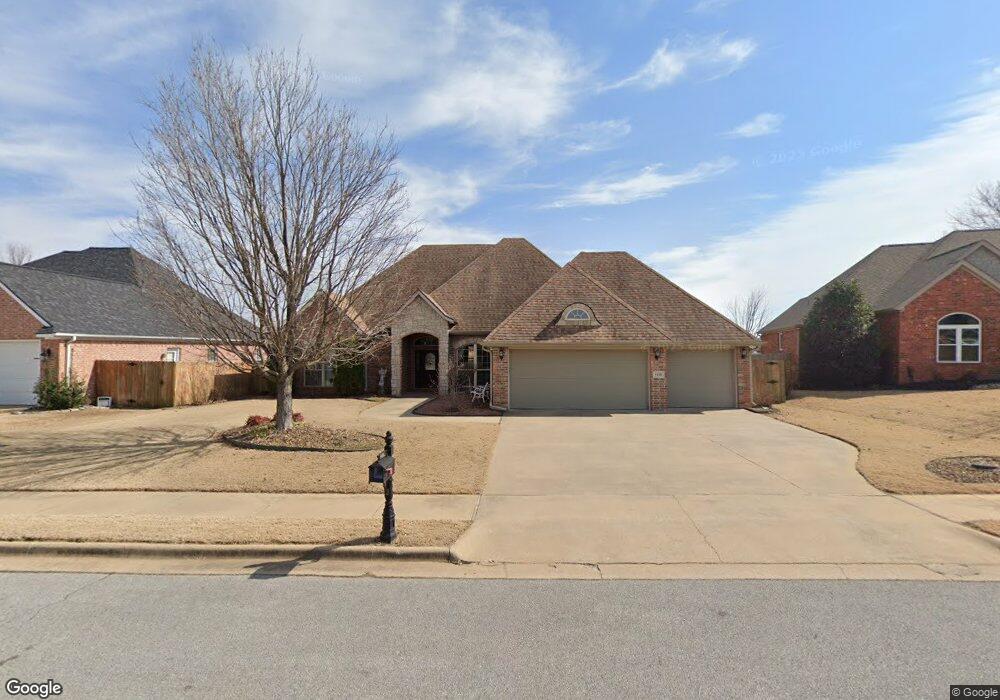
4435 W Collins Cir Rogers, AR 72758
Estimated Value: $511,510 - $547,000
4
Beds
3
Baths
2,255
Sq Ft
$233/Sq Ft
Est. Value
About This Home
This home is located at 4435 W Collins Cir, Rogers, AR 72758 and is currently estimated at $526,378, approximately $233 per square foot. 4435 W Collins Cir is a home located in Benton County with nearby schools including Fairview Elementary School, Elmwood Middle School, and Rogers High School.
Ownership History
Date
Name
Owned For
Owner Type
Purchase Details
Closed on
Dec 5, 2023
Sold by
Thomas Brenda and Myles White
Bought by
White Myles
Current Estimated Value
Home Financials for this Owner
Home Financials are based on the most recent Mortgage that was taken out on this home.
Original Mortgage
$745,500
Outstanding Balance
$659,451
Interest Rate
40%
Mortgage Type
Reverse Mortgage Home Equity Conversion Mortgage
Estimated Equity
-$133,073
Purchase Details
Closed on
Oct 2, 2017
Sold by
Shelor Lyle V
Bought by
Thomas Brenda L and Thomas Betty
Purchase Details
Closed on
Jun 17, 2004
Bought by
Shelor Trs
Purchase Details
Closed on
Feb 13, 2003
Bought by
Jones
Create a Home Valuation Report for This Property
The Home Valuation Report is an in-depth analysis detailing your home's value as well as a comparison with similar homes in the area
Home Values in the Area
Average Home Value in this Area
Purchase History
| Date | Buyer | Sale Price | Title Company |
|---|---|---|---|
| White Myles | -- | None Listed On Document | |
| Thomas Brenda L | $269,900 | Realty Title & Closing Servi | |
| Shelor Trs | $260,000 | -- | |
| Jones | $176,000 | -- |
Source: Public Records
Mortgage History
| Date | Status | Borrower | Loan Amount |
|---|---|---|---|
| Open | White Myles | $745,500 | |
| Closed | White Myles | $745,500 |
Source: Public Records
Tax History
| Year | Tax Paid | Tax Assessment Tax Assessment Total Assessment is a certain percentage of the fair market value that is determined by local assessors to be the total taxable value of land and additions on the property. | Land | Improvement |
|---|---|---|---|---|
| 2025 | $3,600 | $95,857 | $20,000 | $75,857 |
| 2024 | $3,219 | $95,857 | $20,000 | $75,857 |
| 2023 | $2,927 | $63,530 | $15,000 | $48,530 |
| 2022 | $2,668 | $63,530 | $15,000 | $48,530 |
| 2021 | $2,660 | $63,530 | $15,000 | $48,530 |
| 2020 | $2,663 | $55,330 | $6,800 | $48,530 |
| 2019 | $2,663 | $55,330 | $6,800 | $48,530 |
| 2018 | $2,688 | $55,330 | $6,800 | $48,530 |
| 2017 | $2,073 | $55,330 | $6,800 | $48,530 |
| 2016 | $2,073 | $55,330 | $6,800 | $48,530 |
| 2015 | $2,464 | $50,530 | $7,600 | $42,930 |
| 2014 | $2,114 | $50,530 | $7,600 | $42,930 |
Source: Public Records
Map
Nearby Homes
- 5912 S Bellview Rd
- 5910 S Bellview Rd
- 5908 S Bellview Rd
- 5906 S Bellview Rd
- TBD S Pack Ln
- 5704 S Chanberry Ln
- 6107 S 41st St
- 6008 S 40th Place
- 6010 S 40th Place
- 5916 S Bellview Rd
- 5918 S Bellview Rd
- 6012 S 40th Place
- 5904 S Bellview Rd
- 6014 S 40th Place
- 5845 S Bellview Rd
- 4112 W Erin Dr
- 6105 S 41st St
- 6102 S 40th Place
- 6104 S 40th Place
- 5805 S 41st St
- 4435 Collins Cir
- 4435 Collins Dr
- 4433 Collins Cir
- 4437 Collins Cir
- 4437 W Collins Cir
- 4439 W Collins Cir
- 4439 Collins Cir
- 4431 W Collins Cir
- 5721 S Berry Farm Dr
- 4431 Collins Cir
- 5721 Berry Farm Dr
- 4428 Collins Cir
- 4428 W Collins Cir
- 4429 W Collins Cir
- 4429 Collins Cir
- 4441 W Collins Cir
- 5719 Berry Farm Dr
- 4441 Collins Cir
- 5725 Berry Farm Dr
- 4426 W Collins Cir
Your Personal Tour Guide
Ask me questions while you tour the home.