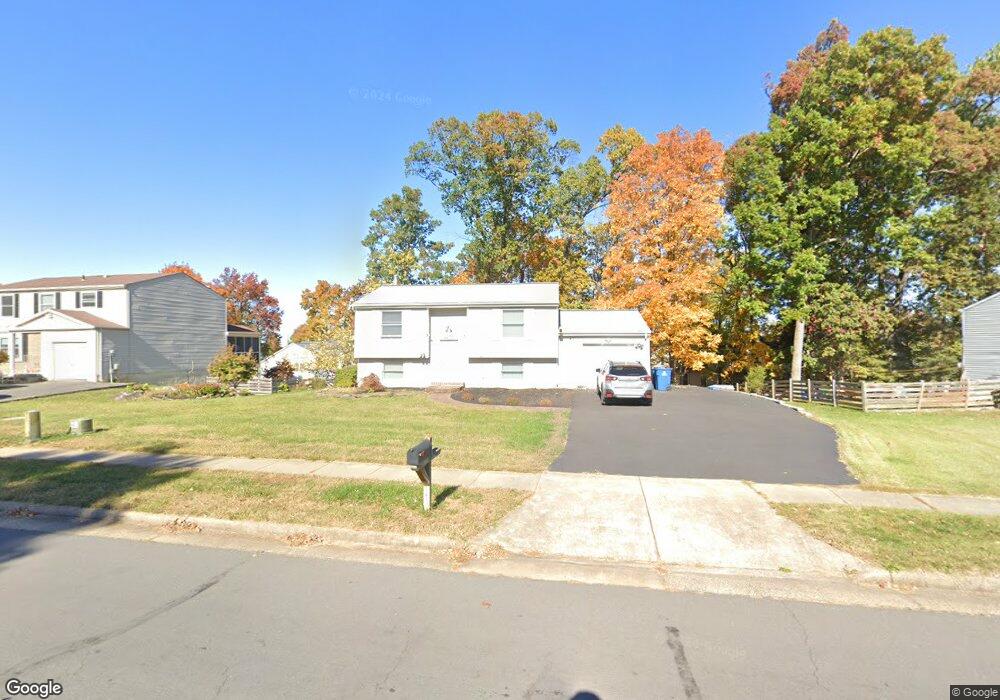
4436 Cub Run Rd Chantilly, VA 20151
Estimated Value: $518,000 - $575,773
2
Beds
1
Bath
797
Sq Ft
$684/Sq Ft
Est. Value
About This Home
This home is located at 4436 Cub Run Rd, Chantilly, VA 20151 and is currently estimated at $545,193, approximately $684 per square foot. 4436 Cub Run Rd is a home located in Fairfax County with nearby schools including Virginia Run Elementary School, Ormond Stone Middle School, and Westfield High School.
Ownership History
Date
Name
Owned For
Owner Type
Purchase Details
Closed on
Oct 15, 2025
Sold by
Freeman Wayne M and Donohue Joanne
Bought by
Brownlee Walter Ernest and Brownlee Lauren Donnelly
Current Estimated Value
Home Financials for this Owner
Home Financials are based on the most recent Mortgage that was taken out on this home.
Original Mortgage
$530,219
Outstanding Balance
$530,219
Interest Rate
6.5%
Mortgage Type
FHA
Estimated Equity
$14,974
Create a Home Valuation Report for This Property
The Home Valuation Report is an in-depth analysis detailing your home's value as well as a comparison with similar homes in the area
Home Values in the Area
Average Home Value in this Area
Purchase History
| Date | Buyer | Sale Price | Title Company |
|---|---|---|---|
| Brownlee Walter Ernest | $540,000 | First American Title |
Source: Public Records
Mortgage History
| Date | Status | Borrower | Loan Amount |
|---|---|---|---|
| Open | Brownlee Walter Ernest | $530,219 |
Source: Public Records
Tax History
| Year | Tax Paid | Tax Assessment Tax Assessment Total Assessment is a certain percentage of the fair market value that is determined by local assessors to be the total taxable value of land and additions on the property. | Land | Improvement |
|---|---|---|---|---|
| 2025 | $6,265 | $550,590 | $240,000 | $310,590 |
| 2024 | $6,265 | $540,810 | $240,000 | $300,810 |
| 2023 | $5,890 | $521,970 | $240,000 | $281,970 |
| 2022 | $5,432 | $475,050 | $230,000 | $245,050 |
| 2021 | $4,761 | $405,720 | $200,000 | $205,720 |
| 2020 | $4,611 | $389,620 | $190,000 | $199,620 |
| 2019 | $4,355 | $368,010 | $185,000 | $183,010 |
| 2018 | $4,107 | $357,090 | $179,000 | $178,090 |
| 2017 | $3,943 | $339,610 | $170,000 | $169,610 |
| 2016 | $3,934 | $339,610 | $170,000 | $169,610 |
Source: Public Records
Map
Nearby Homes
- 4346 Silas Hutchinson Dr
- 4615 Fairfax Manor Ct
- 4616 Fairfax Manor Ct
- 4627 Fairfax Manor Ct
- 4622 Fairfax Manor Ct
- 0 Fairfax Manor Ct Unit VAFX2160912
- 4610 Fairfax Manor Ct
- 4621 Fairfax Manor Ct
- 14938 Deco Cir
- 14930 Deco Cir
- 14926 Deco Cir
- 14731 National Dr
- 4252 Airline Pkwy
- 14951 Deco Cir
- 26005 Hartwood Dr
- 14913 Deco Cir
- 14915 Deco Cir
- 44077 Peirosa Terrace Unit 359
- 14940 Deco Cir
- 14963 Deco Cir
- 4434 Cub Run Rd
- 4438 Cub Run Rd
- 15117 Philip Lee Rd
- 4402 Silas Hutchinson Dr
- 4435 Cub Run Rd
- 4437 Cub Run Rd
- 15119 Philip Lee Rd
- 4432 Cub Run Rd
- 15238 Elk Run Rd
- 4500 Cub Run Rd
- 15235 Elk Run Rd
- 15123 Philip Lee Rd
- 4403 Silas Hutchinson Dr
- 15115 Philip Lee Rd
- 4513 Silas Hutchinson Dr
- 15121 Philip Lee Rd
- 4430 Cub Run Rd
- 4501 Cub Run Rd
- 4431 Cub Run Rd
- 15201 Philip Lee Rd
Your Personal Tour Guide
Ask me questions while you tour the home.