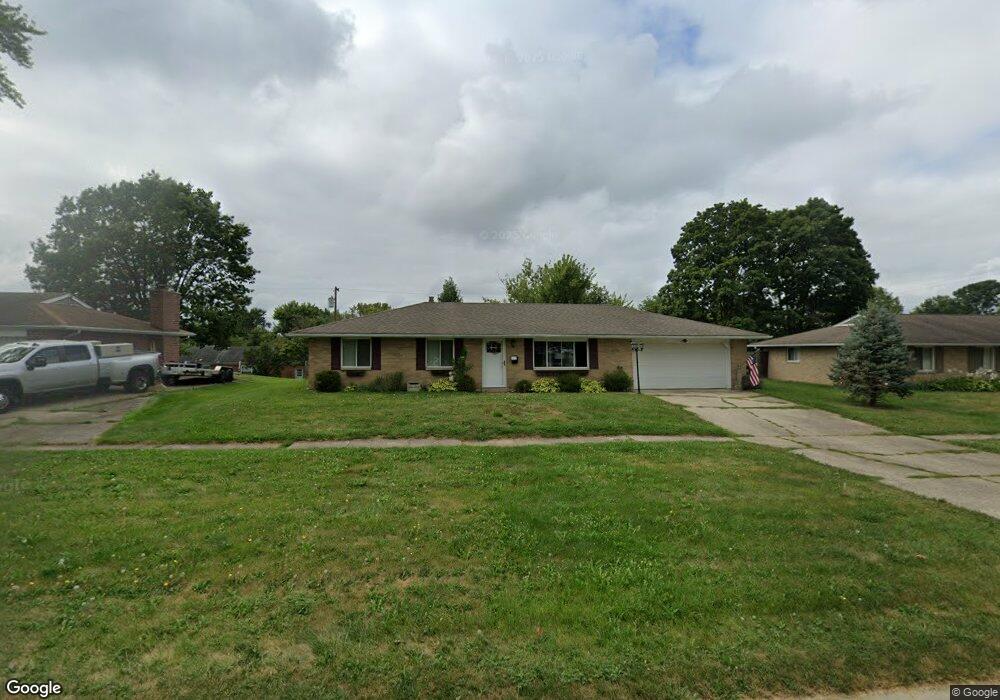
4436 Old Salem Rd Englewood, OH 45322
Estimated Value: $210,000 - $226,000
3
Beds
2
Baths
1,590
Sq Ft
$139/Sq Ft
Est. Value
About This Home
This home is located at 4436 Old Salem Rd, Englewood, OH 45322 and is currently estimated at $220,340, approximately $138 per square foot. 4436 Old Salem Rd is a home located in Montgomery County with nearby schools including Northmoor Elementary School, Northmont High School, and Trotwood Preparatory & Fitness Academy.
Ownership History
Date
Name
Owned For
Owner Type
Purchase Details
Closed on
Jan 20, 2017
Sold by
Lyons Aaron and Lyons Summer
Bought by
Burton Michael A and Burton Kristina D
Current Estimated Value
Home Financials for this Owner
Home Financials are based on the most recent Mortgage that was taken out on this home.
Original Mortgage
$25,000
Outstanding Balance
$19,749
Interest Rate
2.75%
Mortgage Type
Adjustable Rate Mortgage/ARM
Estimated Equity
$200,591
Purchase Details
Closed on
Nov 7, 2011
Sold by
Secretary Of Housing & Urban Development
Bought by
Lyons Aaron and Lyons Summer
Purchase Details
Closed on
Oct 30, 2006
Sold by
Creager Linda J and Rike Kathie L
Bought by
Smuzok Tammy L
Home Financials for this Owner
Home Financials are based on the most recent Mortgage that was taken out on this home.
Original Mortgage
$107,315
Interest Rate
6.36%
Mortgage Type
FHA
Create a Home Valuation Report for This Property
The Home Valuation Report is an in-depth analysis detailing your home's value as well as a comparison with similar homes in the area
Home Values in the Area
Average Home Value in this Area
Purchase History
| Date | Buyer | Sale Price | Title Company |
|---|---|---|---|
| Burton Michael A | $105,000 | Landmark Title Agency South | |
| Lyons Aaron | $51,500 | Attorney | |
| Smuzok Tammy L | $109,000 | Midwest Title Company |
Source: Public Records
Mortgage History
| Date | Status | Borrower | Loan Amount |
|---|---|---|---|
| Open | Burton Michael A | $25,000 | |
| Previous Owner | Smuzok Tammy L | $107,315 |
Source: Public Records
Tax History Compared to Growth
Tax History
| Year | Tax Paid | Tax Assessment Tax Assessment Total Assessment is a certain percentage of the fair market value that is determined by local assessors to be the total taxable value of land and additions on the property. | Land | Improvement |
|---|---|---|---|---|
| 2024 | $2,626 | $54,490 | $13,560 | $40,930 |
| 2023 | $2,626 | $54,490 | $13,560 | $40,930 |
| 2022 | $2,517 | $36,570 | $9,100 | $27,470 |
| 2021 | $2,523 | $36,570 | $9,100 | $27,470 |
| 2020 | $2,522 | $36,570 | $9,100 | $27,470 |
| 2019 | $3,282 | $34,170 | $9,100 | $25,070 |
| 2018 | $3,289 | $34,170 | $9,100 | $25,070 |
| 2017 | $2,861 | $34,170 | $9,100 | $25,070 |
| 2016 | $2,767 | $32,340 | $9,100 | $23,240 |
| 2015 | $2,543 | $32,340 | $9,100 | $23,240 |
| 2014 | $2,543 | $32,340 | $9,100 | $23,240 |
| 2012 | -- | $32,990 | $9,240 | $23,750 |
Source: Public Records
Map
Nearby Homes
- 7000 Kinsey Rd
- 4507 Skylark Dr
- 6701 Park Vista Rd
- 4230 Pleasanton Rd
- 4220 Pleasanton Rd
- 7012 Stillmore Dr
- 5049 Pebble Brook Dr
- 4329 Gorman Ave
- 4711 Valley Brook Dr
- 4030 Gateway Dr
- 4161 Gorman Ave
- 6624 Stranwood Dr
- 6583 Benjamin Franklin Dr
- 229 Brookwood Dr
- 6505 Taywood Rd
- 7201 Mckenna Place
- 4311 Reeves Ct
- 5081 Crescent Ridge Dr Unit 85081
- 7196 Dominican Dr
- 5117 Crescent Ridge Dr Unit 115117
- 4424 Old Salem Rd
- 4448 Old Salem Rd
- 6978 Rushleigh Rd
- 6984 Rushleigh Rd
- 6972 Rushleigh Rd
- 4412 Old Salem Rd
- 4460 Old Salem Rd
- 6966 Rushleigh Rd
- 6900 Kinsey Rd
- 6960 Rushleigh Rd
- 6897 Packingham Dr
- 6896 Packingham Dr
- 6818 Kinsey Rd
- 4500 Old Salem Rd
- 6967 Rushleigh Rd
- 4348 Old Salem Rd
- 6901 Kinsey Rd
- 7006 Kinsey Rd
- 6954 Rushleigh Rd
- 6825 Kinsey Rd