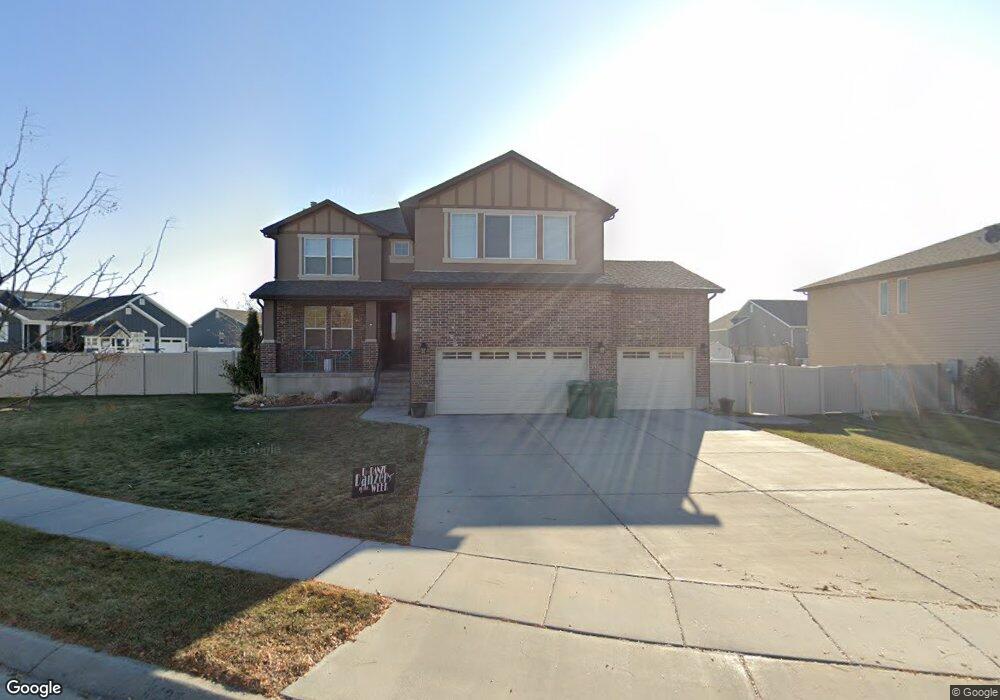
4437 W 5950 S Hooper, UT 84315
Estimated Value: $610,000 - $648,000
4
Beds
3
Baths
3,682
Sq Ft
$170/Sq Ft
Est. Value
About This Home
This home is located at 4437 W 5950 S, Hooper, UT 84315 and is currently estimated at $627,414, approximately $170 per square foot. 4437 W 5950 S is a home located in Weber County with nearby schools including Freedom School, Roy Junior High School, and Roy High School.
Ownership History
Date
Name
Owned For
Owner Type
Purchase Details
Closed on
Nov 4, 2022
Sold by
Jenkins Christopher R and Jenkins Michelle A
Bought by
Christopher And Michelle Jenkins Living Trust and Jenkins
Current Estimated Value
Purchase Details
Closed on
Sep 28, 2012
Sold by
Philpot Nathan and Philpot Jennifer
Bought by
Jenkins Christopher R and Jenkins Michelle A
Home Financials for this Owner
Home Financials are based on the most recent Mortgage that was taken out on this home.
Original Mortgage
$253,650
Interest Rate
3.59%
Mortgage Type
New Conventional
Purchase Details
Closed on
Jul 28, 2009
Sold by
Woodside Wildwood Llc
Bought by
Philpot Nathan and Philpot Jennifer
Home Financials for this Owner
Home Financials are based on the most recent Mortgage that was taken out on this home.
Original Mortgage
$263,145
Interest Rate
5.59%
Mortgage Type
FHA
Create a Home Valuation Report for This Property
The Home Valuation Report is an in-depth analysis detailing your home's value as well as a comparison with similar homes in the area
Home Values in the Area
Average Home Value in this Area
Purchase History
| Date | Buyer | Sale Price | Title Company |
|---|---|---|---|
| Christopher And Michelle Jenkins Living Trust | -- | None Listed On Document | |
| Jenkins Christopher R | -- | Bonneville Superior Title Co | |
| Philpot Nathan | -- | Us Title Insurance Agency |
Source: Public Records
Mortgage History
| Date | Status | Borrower | Loan Amount |
|---|---|---|---|
| Previous Owner | Jenkins Christopher R | $253,650 | |
| Previous Owner | Philpot Nathan | $263,145 |
Source: Public Records
Tax History Compared to Growth
Tax History
| Year | Tax Paid | Tax Assessment Tax Assessment Total Assessment is a certain percentage of the fair market value that is determined by local assessors to be the total taxable value of land and additions on the property. | Land | Improvement |
|---|---|---|---|---|
| 2025 | $3,723 | $599,376 | $198,860 | $400,516 |
| 2024 | $3,772 | $341,000 | $109,373 | $231,627 |
| 2023 | $3,527 | $315,150 | $109,047 | $206,103 |
| 2022 | $3,600 | $331,650 | $84,231 | $247,419 |
| 2021 | $3,058 | $472,000 | $107,893 | $364,107 |
| 2020 | $2,880 | $408,000 | $102,880 | $305,120 |
| 2019 | $2,811 | $376,000 | $101,913 | $274,087 |
| 2018 | $2,705 | $345,000 | $66,794 | $278,206 |
| 2017 | $2,577 | $317,000 | $66,423 | $250,577 |
| 2016 | $2,439 | $161,410 | $36,308 | $125,102 |
| 2015 | $2,346 | $152,649 | $33,504 | $119,145 |
| 2014 | $2,113 | $132,587 | $28,074 | $104,513 |
Source: Public Records
Map
Nearby Homes
- 4438 W 6025 S
- 462 S 4450 W Unit 504
- 3186 W 2600 N
- 4276 W 6025 S
- 3016 W 2650 N
- 2571 N 3200 W
- 3028 W 2600 N
- 2616 N 3020 W
- 2542 N 3300 W
- 4164 W 5950 S
- 4632 W 5750 S
- 2444 N Stanley Crane Dr
- 339 N 3250 W Unit 12
- 5778 S 4075 W
- 5619 S 4525 W
- 4909 W 5850 S
- 2592 W 2650 N
- 5644 S 4075 W
- Torino Farmhouse Plan at Cranefield Estates
- 1700 Farmhouse Plan at Cranefield Estates - Estates Collection
- 4453 W 5950 S
- 4424 W 5950 S
- 6002 S 4400 W Unit 34
- 4469 W 5950 S
- 4440 W 5950 S
- 4426 W 6025 S
- 6022 S 4400 W Unit 35
- 4454 W 5950 S
- 5946 S 4400 W
- 5925 S 4400 W
- 4468 W 5950 S
- 4411 W 6025 S
- 4477 W 5950 S
- 6038 S 4400 W
- 6038 S 4400 W Unit 36
- 6009 S 4375 W
- 4427 W 6025 S
- 4441 W 5900 S
- 4423 W 5900 S
- 4455 W 5900 S