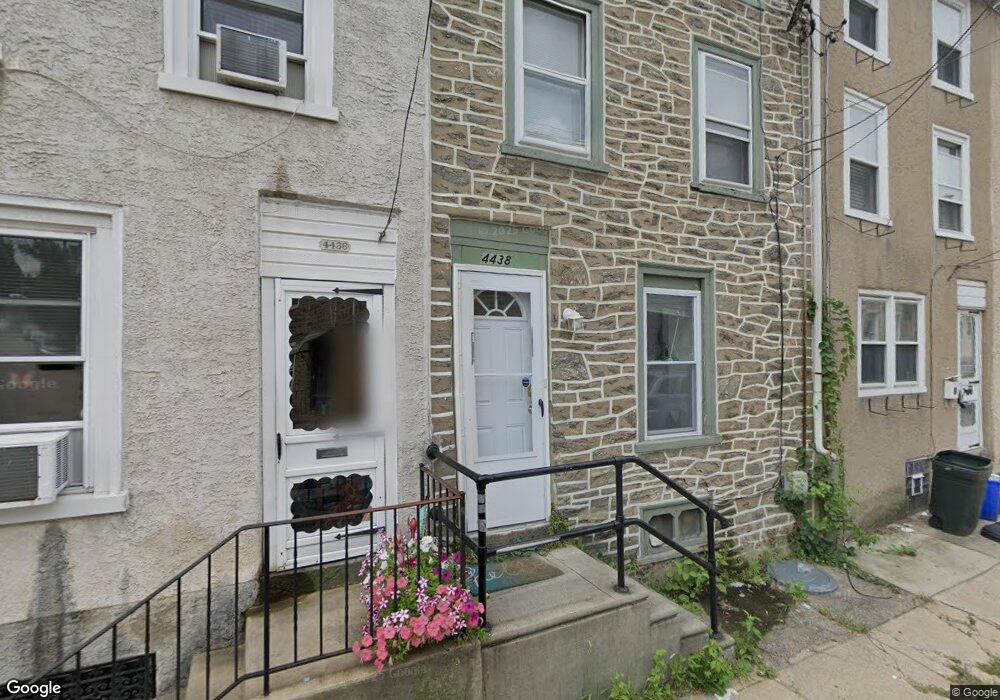
4438 Baker St Unit 3 Philadelphia, PA 19127
Manayunk NeighborhoodEstimated Value: $292,000 - $340,000
2
Beds
2
Baths
1,342
Sq Ft
$235/Sq Ft
Est. Value
About This Home
This home is located at 4438 Baker St Unit 3, Philadelphia, PA 19127 and is currently estimated at $315,101, approximately $234 per square foot. 4438 Baker St Unit 3 is a home located in Philadelphia County with nearby schools including White Oaks Elementary School, James Dobson Elementary School, and Roxborough High School.
Ownership History
Date
Name
Owned For
Owner Type
Purchase Details
Closed on
May 30, 2024
Sold by
Toll Richard E
Bought by
Miller Lauren M
Current Estimated Value
Home Financials for this Owner
Home Financials are based on the most recent Mortgage that was taken out on this home.
Original Mortgage
$237,650
Outstanding Balance
$234,290
Interest Rate
7.17%
Mortgage Type
New Conventional
Estimated Equity
$80,811
Purchase Details
Closed on
Dec 19, 2003
Sold by
Copperman Barbara and Levy Susan J
Bought by
Toll Richard E and Toll Carol R
Home Financials for this Owner
Home Financials are based on the most recent Mortgage that was taken out on this home.
Original Mortgage
$103,000
Interest Rate
5.65%
Mortgage Type
Purchase Money Mortgage
Create a Home Valuation Report for This Property
The Home Valuation Report is an in-depth analysis detailing your home's value as well as a comparison with similar homes in the area
Home Values in the Area
Average Home Value in this Area
Purchase History
| Date | Buyer | Sale Price | Title Company |
|---|---|---|---|
| Miller Lauren M | $245,000 | None Listed On Document | |
| Toll Richard E | $159,000 | -- |
Source: Public Records
Mortgage History
| Date | Status | Borrower | Loan Amount |
|---|---|---|---|
| Open | Miller Lauren M | $237,650 | |
| Previous Owner | Toll Richard E | $103,000 |
Source: Public Records
Tax History Compared to Growth
Tax History
| Year | Tax Paid | Tax Assessment Tax Assessment Total Assessment is a certain percentage of the fair market value that is determined by local assessors to be the total taxable value of land and additions on the property. | Land | Improvement |
|---|---|---|---|---|
| 2026 | $3,652 | $300,000 | $60,000 | $240,000 |
| 2025 | $3,652 | $300,000 | $60,000 | $240,000 |
| 2024 | $3,652 | $300,000 | $60,000 | $240,000 |
| 2023 | $3,652 | $260,900 | $52,180 | $208,720 |
| 2022 | $3,061 | $260,900 | $52,180 | $208,720 |
| 2021 | $3,061 | $0 | $0 | $0 |
| 2020 | $3,061 | $0 | $0 | $0 |
| 2019 | $3,010 | $0 | $0 | $0 |
| 2018 | $2,520 | $0 | $0 | $0 |
| 2017 | $2,520 | $0 | $0 | $0 |
| 2016 | $2,520 | $0 | $0 | $0 |
| 2015 | $17,588 | $0 | $0 | $0 |
| 2014 | -- | $180,000 | $36,000 | $144,000 |
| 2012 | -- | $19,424 | $1,665 | $17,759 |
Source: Public Records
Map
Nearby Homes