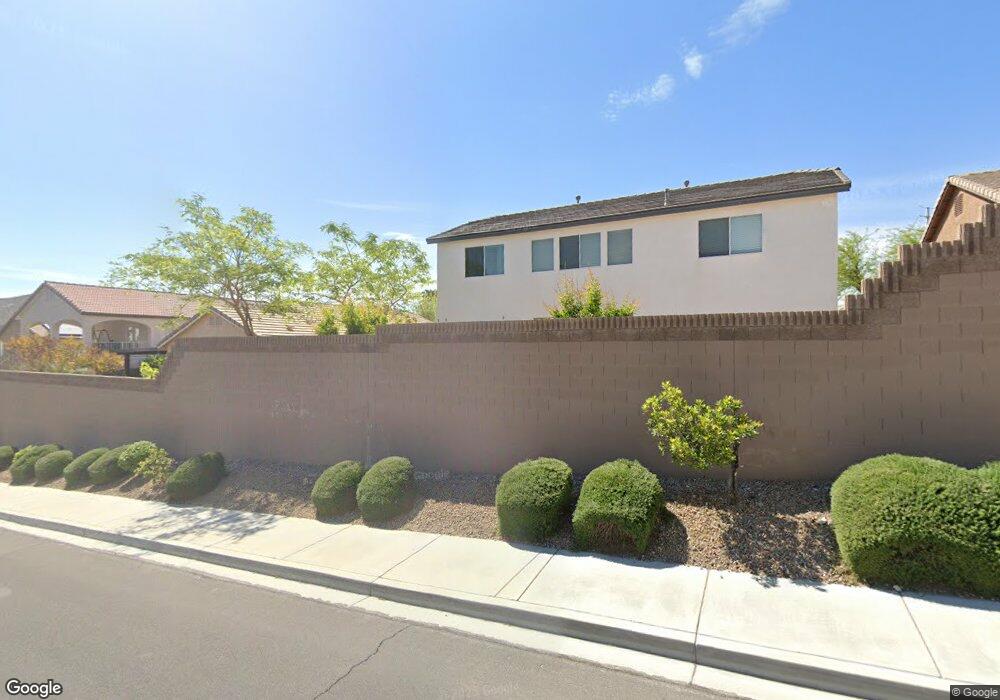
4438 Rehoboth Bay St Las Vegas, NV 89129
Lone Mountain NeighborhoodEstimated Value: $564,000 - $622,000
4
Beds
3
Baths
2,207
Sq Ft
$266/Sq Ft
Est. Value
About This Home
This home is located at 4438 Rehoboth Bay St, Las Vegas, NV 89129 and is currently estimated at $587,988, approximately $266 per square foot. 4438 Rehoboth Bay St is a home located in Clark County with nearby schools including Eileen Conners Elementary School, Justice Myron E Leavitt Middle School, and Centennial High School.
Ownership History
Date
Name
Owned For
Owner Type
Purchase Details
Closed on
Jul 13, 2023
Sold by
Price Gerald W and Price Julie A
Bought by
Price Family Trust and Price
Current Estimated Value
Purchase Details
Closed on
Mar 19, 2012
Sold by
Quantum Homes Llc Series 4438
Bought by
Price Gerald W and Price Julie A
Home Financials for this Owner
Home Financials are based on the most recent Mortgage that was taken out on this home.
Original Mortgage
$169,600
Interest Rate
3.83%
Mortgage Type
New Conventional
Purchase Details
Closed on
Jan 4, 2012
Sold by
Dinglasan Francisco O and Dinglasan Milagros R
Bought by
Quantum Homes Llc Series 4438
Purchase Details
Closed on
Jan 22, 2003
Sold by
Concordia Lone Mountain Llc
Bought by
Dinglasan Francisco O and Dinglasan Milagros R
Home Financials for this Owner
Home Financials are based on the most recent Mortgage that was taken out on this home.
Original Mortgage
$201,113
Interest Rate
5.96%
Create a Home Valuation Report for This Property
The Home Valuation Report is an in-depth analysis detailing your home's value as well as a comparison with similar homes in the area
Home Values in the Area
Average Home Value in this Area
Purchase History
| Date | Buyer | Sale Price | Title Company |
|---|---|---|---|
| Price Family Trust | -- | None Listed On Document | |
| Price Gerald W | $212,000 | Fidelity National Title Las | |
| Quantum Homes Llc Series 4438 | $132,501 | First American Title | |
| Dinglasan Francisco O | $211,698 | First American Title Company |
Source: Public Records
Mortgage History
| Date | Status | Borrower | Loan Amount |
|---|---|---|---|
| Previous Owner | Price Gerald W | $169,600 | |
| Previous Owner | Dinglasan Francisco O | $201,113 |
Source: Public Records
Tax History Compared to Growth
Tax History
| Year | Tax Paid | Tax Assessment Tax Assessment Total Assessment is a certain percentage of the fair market value that is determined by local assessors to be the total taxable value of land and additions on the property. | Land | Improvement |
|---|---|---|---|---|
| 2025 | $2,610 | $147,040 | $36,400 | $110,640 |
| 2024 | $2,644 | $147,040 | $36,400 | $110,640 |
| 2023 | $2,644 | $144,878 | $40,950 | $103,928 |
| 2022 | $2,567 | $133,066 | $37,800 | $95,266 |
| 2021 | $2,493 | $120,970 | $30,800 | $90,170 |
| 2020 | $2,417 | $118,754 | $29,400 | $89,354 |
| 2019 | $2,347 | $112,318 | $24,500 | $87,818 |
| 2018 | $2,278 | $106,613 | $22,050 | $84,563 |
| 2017 | $3,425 | $104,488 | $22,050 | $82,438 |
| 2016 | $2,158 | $85,046 | $15,050 | $69,996 |
| 2015 | $2,153 | $71,433 | $12,250 | $59,183 |
| 2014 | $2,008 | $71,557 | $8,750 | $62,807 |
Source: Public Records
Map
Nearby Homes
- 10531 Beckaville Ave
- 4307 Holleys Hill St
- 10701 Morning Harbor Ave Unit 7
- 4337 Governors Hill St Unit 5
- 10642 Cliff Ridge Ave Unit 6
- 10405 Golden Reflection Ct Unit 3
- 4208 Holleys Hill St
- 4612 Plum Button St
- 4337 Western Front St
- 10485 Canyon Cliff Ct Unit 5
- 4576 Amazing View St
- 10776 Princeton Bluff Ln
- 10550 W Alexander Rd Unit 2066
- 10550 W Alexander Rd Unit 1157
- 10550 W Alexander Rd Unit 2040
- 10550 W Alexander Rd Unit 2059
- 10550 W Alexander Rd Unit 1152
- 10550 W Alexander Rd Unit 2193
- 10550 W Alexander Rd Unit 1068
- 10550 W Alexander Rd Unit 2008
- 4442 Rehoboth Bay St Unit 4
- 4434 Rehoboth Bay St
- 4430 Rehoboth Bay St
- 10643 Suffolk Hills Ave Unit 4
- 10640 Yarmouth Key Ct
- 4426 Rehoboth Bay St
- 10634 Suffolk Hills Ave Unit 4
- 10630 Suffolk Hills Ave
- 10638 Suffolk Hills Ave
- 4425 Peaceful Morning Ln
- 4421 Peaceful Morning Ln
- 10647 Suffolk Hills Ave Unit 4
- 4429 Peaceful Morning Ln
- 10642 Suffolk Hills Ave Unit 4
- 10644 Yarmouth Key Ct
- 4422 Rehoboth Bay St
- 4417 Peaceful Morning Ln
- 4433 Peaceful Morning Ln
- 10646 Suffolk Hills Ave
- 4413 Peaceful Morning Ln