Estimated Value: $425,000 - $456,000
4
Beds
1
Bath
1,404
Sq Ft
$310/Sq Ft
Est. Value
About This Home
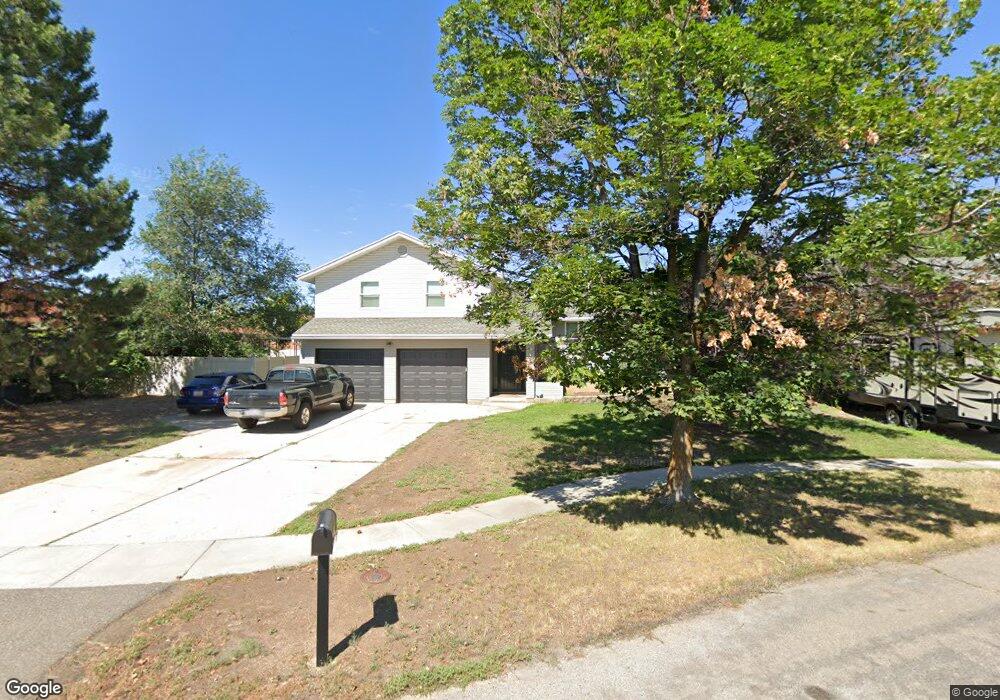
This home is located at 4439 S 1675 W, Roy, UT 84067 and is currently estimated at $435,154, approximately $309 per square foot. 4439 S 1675 W is a home located in Weber County with nearby schools including Valley View School, Sand Ridge Junior High School, and Roy High School.
Ownership History
Date
Name
Owned For
Owner Type
Purchase Details
Closed on
Sep 9, 2020
Sold by
Barker Joseph J
Bought by
Barker Joseph Jeremy
Current Estimated Value
Home Financials for this Owner
Home Financials are based on the most recent Mortgage that was taken out on this home.
Original Mortgage
$275,450
Outstanding Balance
$244,444
Interest Rate
2.9%
Mortgage Type
New Conventional
Estimated Equity
$190,710
Purchase Details
Closed on
Feb 21, 2019
Sold by
Panunzio Robert J and Panunzio Susan L
Bought by
Barker Joseph J
Home Financials for this Owner
Home Financials are based on the most recent Mortgage that was taken out on this home.
Original Mortgage
$271,600
Interest Rate
4.4%
Mortgage Type
New Conventional
Purchase Details
Closed on
Nov 23, 2002
Sold by
Panunzio Robert J and Panunzio Eva
Bought by
Panunzio Robert J and Panunzio Susan L
Home Financials for this Owner
Home Financials are based on the most recent Mortgage that was taken out on this home.
Original Mortgage
$56,000
Interest Rate
6.12%
Create a Home Valuation Report for This Property
The Home Valuation Report is an in-depth analysis detailing your home's value as well as a comparison with similar homes in the area
Home Values in the Area
Average Home Value in this Area
Purchase History
| Date | Buyer | Sale Price | Title Company |
|---|---|---|---|
| Barker Joseph Jeremy | -- | First Amer Ttl Legend Hil | |
| Barker Joseph J | -- | American Secure Title Layton | |
| Panunzio Robert J | -- | Bonneville Title |
Source: Public Records
Mortgage History
| Date | Status | Borrower | Loan Amount |
|---|---|---|---|
| Open | Barker Joseph Jeremy | $275,450 | |
| Closed | Barker Joseph J | $271,600 | |
| Previous Owner | Panunzio Robert J | $56,000 |
Source: Public Records
Tax History
| Year | Tax Paid | Tax Assessment Tax Assessment Total Assessment is a certain percentage of the fair market value that is determined by local assessors to be the total taxable value of land and additions on the property. | Land | Improvement |
|---|---|---|---|---|
| 2025 | $2,673 | $424,698 | $149,474 | $275,224 |
| 2024 | $2,611 | $229,899 | $82,218 | $147,681 |
| 2023 | $2,576 | $227,700 | $80,106 | $147,594 |
| 2022 | $2,451 | $221,650 | $64,175 | $157,475 |
| 2021 | $2,113 | $315,000 | $82,560 | $232,440 |
| 2020 | $1,908 | $260,000 | $82,560 | $177,440 |
| 2019 | $1,946 | $251,000 | $47,975 | $203,025 |
| 2018 | $1,810 | $219,000 | $43,122 | $175,878 |
| 2017 | $1,667 | $188,000 | $43,122 | $144,878 |
| 2016 | $1,594 | $96,557 | $23,953 | $72,604 |
| 2015 | $1,442 | $88,969 | $21,285 | $67,684 |
| 2014 | $1,392 | $84,558 | $21,285 | $63,273 |
Source: Public Records
Map
Nearby Homes
- 4593 Promenade Dr Unit 16
- 4536 S 1900 W Unit 12
- 4539 S 1800 W Unit 127
- 4602 Hathaway Dr
- 4642 S 1900 W Unit 41
- 2015 W 4225 S
- 2038 W 4600 S
- 4220 S 2075 W
- 4533 S 2075 W
- 1219 W 4500 S
- 4328 S 2175 W
- 1783 W 5000 S
- 1789 W 5000 S
- 1959 3985 St S Unit 2
- 5006 S 1800 W
- 1765 W 5000 S
- 1838 W 5050 S
- 1910 W 3920 S
- 1829 W 5050 S
- 1114 W 4650 S