Estimated Value: $405,000 - $424,000
3
Beds
2
Baths
1,882
Sq Ft
$223/Sq Ft
Est. Value
About This Home
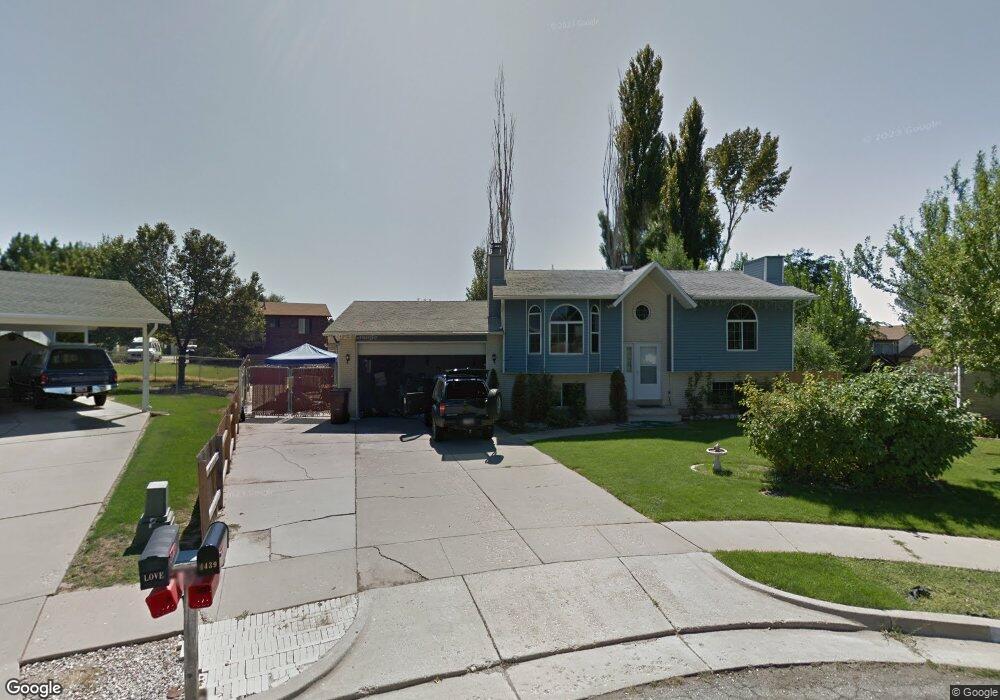
This home is located at 4439 S 2850 W, Roy, UT 84067 and is currently estimated at $418,909, approximately $222 per square foot. 4439 S 2850 W is a home located in Weber County with nearby schools including Midland School, Sand Ridge Junior High School, and Roy High School.
Ownership History
Date
Name
Owned For
Owner Type
Purchase Details
Closed on
Jun 3, 2011
Sold by
Benedetti Robert G and Benedetti Elizabeth L
Bought by
Wilcox Christopher
Current Estimated Value
Home Financials for this Owner
Home Financials are based on the most recent Mortgage that was taken out on this home.
Original Mortgage
$102,338
Outstanding Balance
$70,550
Interest Rate
4.63%
Mortgage Type
FHA
Estimated Equity
$348,359
Purchase Details
Closed on
Jun 1, 1999
Sold by
Butler William G and Butler Louise R
Bought by
Benedetti Robert G
Home Financials for this Owner
Home Financials are based on the most recent Mortgage that was taken out on this home.
Original Mortgage
$110,400
Interest Rate
10%
Mortgage Type
Purchase Money Mortgage
Purchase Details
Closed on
May 23, 1997
Sold by
Martinez Sylvia A
Bought by
Butler William Glenn
Purchase Details
Closed on
Apr 1, 1996
Sold by
Martinez Steven Ian
Bought by
Martinez Sylvia A
Create a Home Valuation Report for This Property
The Home Valuation Report is an in-depth analysis detailing your home's value as well as a comparison with similar homes in the area
Home Values in the Area
Average Home Value in this Area
Purchase History
| Date | Buyer | Sale Price | Title Company |
|---|---|---|---|
| Wilcox Christopher | -- | Premium Title | |
| Benedetti Robert G | -- | Backman Stewart Title | |
| Butler William Glenn | -- | First American Title | |
| Martinez Sylvia A | -- | -- |
Source: Public Records
Mortgage History
| Date | Status | Borrower | Loan Amount |
|---|---|---|---|
| Open | Wilcox Christopher | $102,338 | |
| Previous Owner | Benedetti Robert G | $110,400 |
Source: Public Records
Tax History Compared to Growth
Tax History
| Year | Tax Paid | Tax Assessment Tax Assessment Total Assessment is a certain percentage of the fair market value that is determined by local assessors to be the total taxable value of land and additions on the property. | Land | Improvement |
|---|---|---|---|---|
| 2025 | $2,478 | $389,114 | $138,432 | $250,682 |
| 2024 | $2,421 | $210,649 | $76,137 | $134,512 |
| 2023 | $2,296 | $199,650 | $73,424 | $126,226 |
| 2022 | $2,431 | $218,900 | $62,525 | $156,375 |
| 2021 | $2,095 | $311,000 | $78,726 | $232,274 |
| 2020 | $1,940 | $264,000 | $78,726 | $185,274 |
| 2019 | $1,895 | $243,000 | $47,990 | $195,010 |
| 2018 | $1,793 | $216,000 | $47,990 | $168,010 |
| 2017 | $1,741 | $197,000 | $46,041 | $150,959 |
| 2016 | $1,563 | $94,192 | $25,887 | $68,305 |
| 2015 | $1,456 | $89,755 | $25,887 | $63,868 |
| 2014 | $1,469 | $89,755 | $25,887 | $63,868 |
Source: Public Records
Map
Nearby Homes
- 2816 W 4400 S
- 2802 W 4375 S
- 4635 S 2950 W
- 2979 W 4275 S
- 2835 W 4200 S
- 3084 W 4375 S
- 2642 W 4400 S
- 3014 W 4750 S
- 2777 W 4175 S Unit 229
- 2778 W 4175 S Unit 235
- 1952 W 5450 S
- 3046 W 4850 S
- 4670 S 2525 W
- 4440 Stone Creek Rd Unit 2E
- 4891 S 2875 W
- 4118 Westlake Dr
- 4875 S 2675 W
- 4022 S 2725 W
- 4510 Stone Creek Rd Unit F
- 4918 S 2925 W