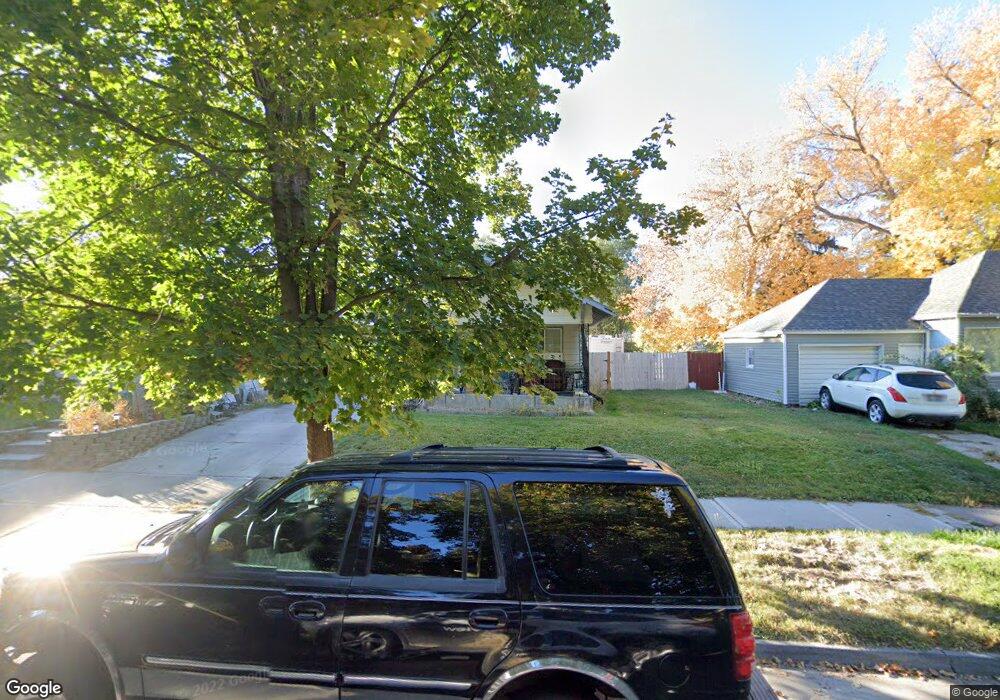
444 11th St Idaho Falls, ID 83404
Estimated Value: $249,000 - $284,000
2
Beds
1
Bath
1,200
Sq Ft
$220/Sq Ft
Est. Value
About This Home
This home is located at 444 11th St, Idaho Falls, ID 83404 and is currently estimated at $263,792, approximately $219 per square foot. 444 11th St is a home located in Bonneville County with nearby schools including Hawthorne Elementary School, Taylorview Middle School, and Idaho Falls Senior High School.
Ownership History
Date
Name
Owned For
Owner Type
Purchase Details
Closed on
Nov 11, 2009
Sold by
Peacock William L and Peacock Flora L
Bought by
Lund Glen B and Lund Suzann
Current Estimated Value
Home Financials for this Owner
Home Financials are based on the most recent Mortgage that was taken out on this home.
Original Mortgage
$62,400
Outstanding Balance
$40,578
Interest Rate
4.92%
Mortgage Type
New Conventional
Estimated Equity
$223,214
Create a Home Valuation Report for This Property
The Home Valuation Report is an in-depth analysis detailing your home's value as well as a comparison with similar homes in the area
Home Values in the Area
Average Home Value in this Area
Purchase History
| Date | Buyer | Sale Price | Title Company |
|---|---|---|---|
| Lund Glen B | -- | -- |
Source: Public Records
Mortgage History
| Date | Status | Borrower | Loan Amount |
|---|---|---|---|
| Open | Lund Glen B | $62,400 |
Source: Public Records
Tax History Compared to Growth
Tax History
| Year | Tax Paid | Tax Assessment Tax Assessment Total Assessment is a certain percentage of the fair market value that is determined by local assessors to be the total taxable value of land and additions on the property. | Land | Improvement |
|---|---|---|---|---|
| 2025 | $1,787 | $261,294 | $66,322 | $194,972 |
| 2024 | $1,787 | $225,960 | $45,725 | $180,235 |
| 2023 | $1,855 | $189,855 | $45,725 | $144,130 |
| 2022 | $1,740 | $136,727 | $30,767 | $105,960 |
| 2021 | $1,410 | $113,827 | $30,767 | $83,060 |
| 2019 | $1,646 | $89,734 | $25,644 | $64,090 |
| 2018 | $1,492 | $91,396 | $23,326 | $68,070 |
| 2017 | $1,386 | $78,545 | $16,965 | $61,580 |
| 2016 | $1,305 | $73,606 | $15,416 | $58,190 |
| 2015 | $1,297 | $68,566 | $15,416 | $53,150 |
| 2014 | $36,209 | $68,566 | $15,416 | $53,150 |
| 2013 | $1,358 | $74,226 | $15,416 | $58,810 |
Source: Public Records
Map
Nearby Homes