444 Apollo Dr Sidney, OH 45365
Estimated Value: $227,942 - $264,000
3
Beds
2
Baths
1,576
Sq Ft
$157/Sq Ft
Est. Value
About This Home
This home is located at 444 Apollo Dr, Sidney, OH 45365 and is currently estimated at $247,736, approximately $157 per square foot. 444 Apollo Dr is a home located in Shelby County with nearby schools including Sidney High School, Holy Angels Catholic School, and Christian Academy Schools.
Ownership History
Date
Name
Owned For
Owner Type
Purchase Details
Closed on
Nov 20, 2020
Sold by
Windham Michael D and Windham Ellen D
Bought by
Presser Randolph and Foran Victoria
Current Estimated Value
Home Financials for this Owner
Home Financials are based on the most recent Mortgage that was taken out on this home.
Original Mortgage
$185,576
Outstanding Balance
$165,136
Interest Rate
2.8%
Mortgage Type
FHA
Estimated Equity
$82,600
Purchase Details
Closed on
Sep 26, 2013
Sold by
Wolfe Betty L
Bought by
Windham Michael D and Windham Ellen D
Home Financials for this Owner
Home Financials are based on the most recent Mortgage that was taken out on this home.
Original Mortgage
$130,150
Interest Rate
4.39%
Mortgage Type
New Conventional
Purchase Details
Closed on
Jul 1, 1999
Sold by
Billing Homer J
Bought by
Wolfe James R
Purchase Details
Closed on
Sep 5, 1996
Sold by
Mcgee Roger C
Bought by
Billing Homer J and Billing Julia M
Create a Home Valuation Report for This Property
The Home Valuation Report is an in-depth analysis detailing your home's value as well as a comparison with similar homes in the area
Home Values in the Area
Average Home Value in this Area
Purchase History
| Date | Buyer | Sale Price | Title Company |
|---|---|---|---|
| Presser Randolph | $189,000 | Attorney | |
| Windham Michael D | $137,000 | None Available | |
| Wolfe James R | $95,000 | -- | |
| Billing Homer J | $94,700 | -- |
Source: Public Records
Mortgage History
| Date | Status | Borrower | Loan Amount |
|---|---|---|---|
| Open | Presser Randolph | $185,576 | |
| Previous Owner | Windham Michael D | $130,150 |
Source: Public Records
Tax History
| Year | Tax Paid | Tax Assessment Tax Assessment Total Assessment is a certain percentage of the fair market value that is determined by local assessors to be the total taxable value of land and additions on the property. | Land | Improvement |
|---|---|---|---|---|
| 2024 | $2,185 | $58,840 | $10,670 | $48,170 |
| 2023 | $2,063 | $58,840 | $10,670 | $48,170 |
| 2022 | $1,809 | $45,240 | $9,350 | $35,890 |
| 2021 | $1,828 | $45,240 | $9,350 | $35,890 |
| 2020 | $1,827 | $45,240 | $9,350 | $35,890 |
| 2019 | $1,587 | $38,840 | $7,740 | $31,100 |
| 2018 | $1,542 | $38,840 | $7,740 | $31,100 |
| 2017 | $1,526 | $38,840 | $7,740 | $31,100 |
| 2016 | $1,443 | $36,660 | $7,740 | $28,920 |
| 2015 | $1,447 | $36,660 | $7,740 | $28,920 |
| 2014 | $1,447 | $36,660 | $7,740 | $28,920 |
| 2013 | $1,111 | $34,750 | $7,740 | $27,010 |
Source: Public Records
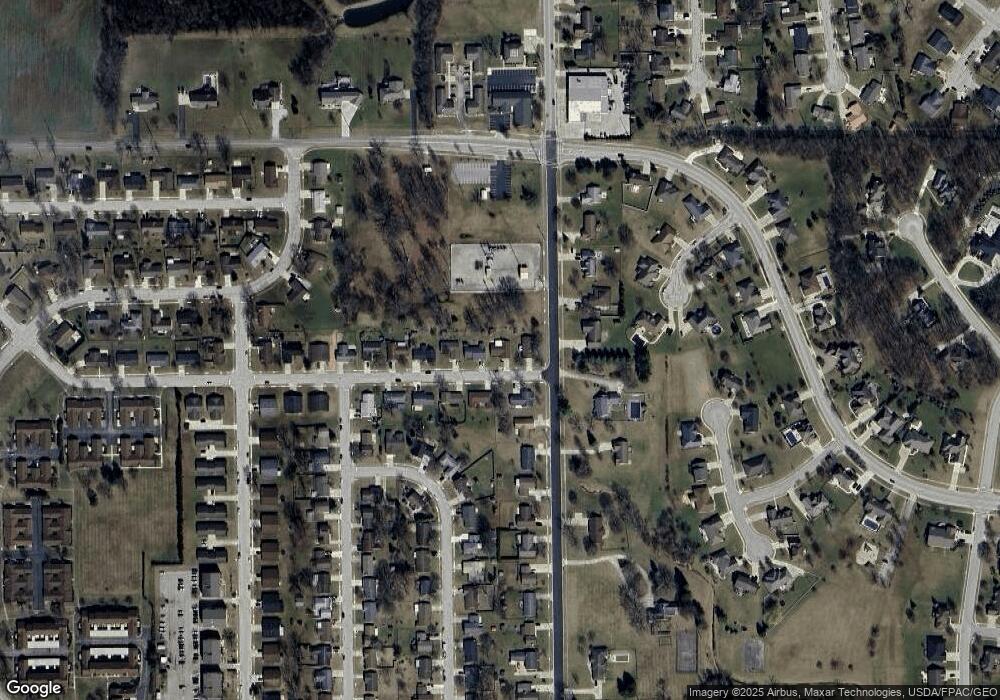
Map
Nearby Homes
- 2437 Armstrong Dr
- 2403 Armstrong Dr
- 2625 Spearhead Ct
- 173 Tranquility Ct
- 2816 Broadway Ave
- 0 Sunshine Dr
- 3095 Thompson Schiff Rd
- 136 Village Green Dr
- 2732 Summer Field Trail
- 1163 Marvin Gene Ct
- 115 E Pinehurst St
- 0 Windsor Park
- 2805 Wapakoneta Ave Unit 49
- 2805 Wapakoneta Ave Unit 14
- 526 W Hoewisher Rd
- 307 E Ruth St
- 308 E Lyndhurst St
- 637 Greenbriar Ct
- 3095 Thompson-Schiff Rd
- 955 Winter Ridge Dr
- 444 Apollo St
- 436 Apollo Dr
- 436 Apollo Dr
- 452 Apollo Dr
- 430 Apollo Dr
- 445 Apollo Dr
- 439 Apollo Dr
- 431 Apollo Dr
- 420 Apollo Dr
- 420 Apollo St
- 2435 Broadway Ave
- 2514 Broadway Ave
- 421 Apollo Dr
- 2518 Broadway Ave
- 2422 Armstrong Dr
- 2427 Broadway Ave
- 412 Apollo Dr
- 413 Apollo St
- 2430 Armstrong Dr
- 413 Apollo Dr
Your Personal Tour Guide
Ask me questions while you tour the home.