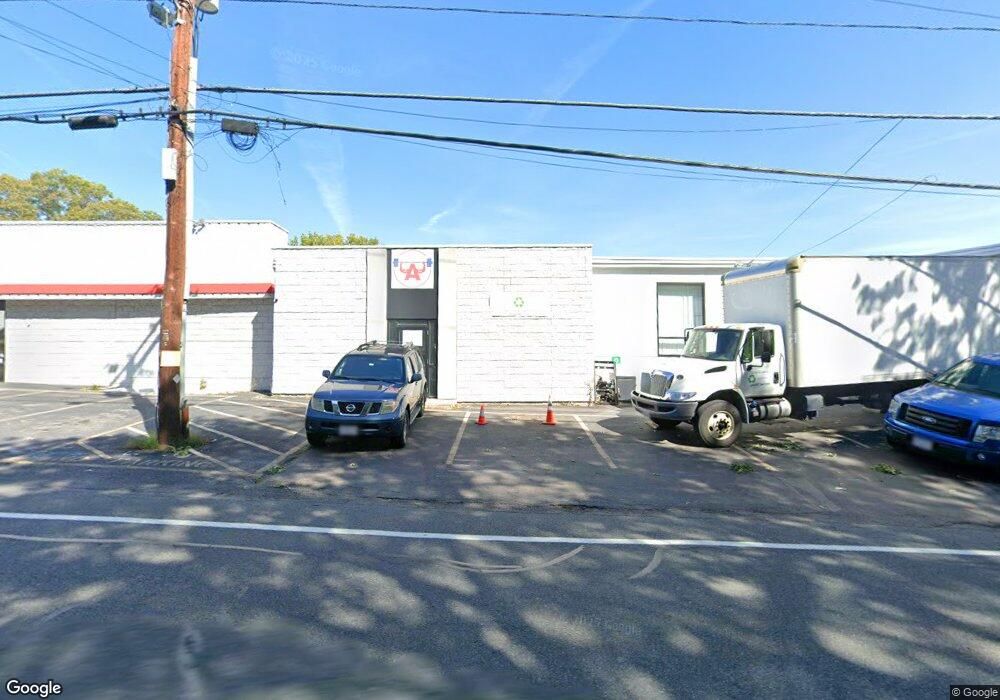
444 Central St Leominster, MA 01453
Estimated Value: $1,283,855
Studio
2
Baths
3,400
Sq Ft
$378/Sq Ft
Est. Value
About This Home
This home is located at 444 Central St, Leominster, MA 01453 and is currently estimated at $1,283,855, approximately $377 per square foot. 444 Central St is a home located in Worcester County with nearby schools including Leominster High School, St. Anna Catholic School, and St. Leo School.
Ownership History
Date
Name
Owned For
Owner Type
Purchase Details
Closed on
Jun 30, 2017
Sold by
Bjr Realty Inc
Bought by
Central Realty Group L
Current Estimated Value
Home Financials for this Owner
Home Financials are based on the most recent Mortgage that was taken out on this home.
Original Mortgage
$524,000
Outstanding Balance
$429,520
Interest Rate
4.02%
Mortgage Type
Commercial
Estimated Equity
$854,335
Purchase Details
Closed on
Jan 13, 2004
Sold by
444 Central Street Llc
Bought by
Bjr Realty Inc
Home Financials for this Owner
Home Financials are based on the most recent Mortgage that was taken out on this home.
Original Mortgage
$575,000
Interest Rate
5.88%
Mortgage Type
Commercial
Purchase Details
Closed on
Oct 30, 2001
Sold by
Miller Rt and Gillis
Bought by
444 Central St Llc
Purchase Details
Closed on
Feb 22, 2000
Sold by
Albert Joseh H Est and Byrne
Bought by
Miller Rt and Gillis
Create a Home Valuation Report for This Property
The Home Valuation Report is an in-depth analysis detailing your home's value as well as a comparison with similar homes in the area
Home Values in the Area
Average Home Value in this Area
Purchase History
| Date | Buyer | Sale Price | Title Company |
|---|---|---|---|
| Central Realty Group L | $699,000 | -- | |
| Bjr Realty Inc | $540,000 | -- | |
| Bjr Realty Inc | $540,000 | -- | |
| 444 Central St Llc | $390,000 | -- | |
| 444 Central St Llc | $390,000 | -- | |
| Miller Rt | $3,000 | -- | |
| Miller Rt | $3,000 | -- |
Source: Public Records
Mortgage History
| Date | Status | Borrower | Loan Amount |
|---|---|---|---|
| Open | Central Realty Group L | $524,000 | |
| Closed | Miller Rt | $524,000 | |
| Previous Owner | Bjr Realty Inc | $575,000 |
Source: Public Records
Tax History
| Year | Tax Paid | Tax Assessment Tax Assessment Total Assessment is a certain percentage of the fair market value that is determined by local assessors to be the total taxable value of land and additions on the property. | Land | Improvement |
|---|---|---|---|---|
| 2025 | $14,043 | $1,000,900 | $155,500 | $845,400 |
| 2024 | $13,621 | $938,700 | $148,000 | $790,700 |
| 2023 | $13,869 | $892,500 | $148,000 | $744,500 |
| 2022 | $13,313 | $803,900 | $128,700 | $675,200 |
| 2021 | $13,110 | $723,100 | $128,700 | $594,400 |
| 2020 | $13,001 | $723,100 | $128,700 | $594,400 |
| 2019 | $12,781 | $689,400 | $128,700 | $560,700 |
| 2018 | $14,213 | $735,300 | $56,100 | $679,200 |
| 2017 | $14,507 | $735,300 | $56,100 | $679,200 |
| 2016 | $14,397 | $735,300 | $56,100 | $679,200 |
| 2015 | $14,294 | $735,300 | $56,100 | $679,200 |
| 2014 | $13,780 | $729,500 | $80,300 | $649,200 |
Source: Public Records
Map
Nearby Homes
- 556 Central St Unit 141
- 556 Central St Unit 183
- 556 Central St Unit 11
- 25 Meadow Pond Dr Unit j
- 20 Abbey Rd Unit 105
- 30 Abbey Rd Unit 202
- 0 Wheeler St
- 47 Carolyn St
- 372 Litchfield St
- 65 Gordon St
- 59 Webber St
- 123 Lancaster St
- 0 Johnson St
- 77 Carter St
- 60 Howard St
- 59 Lancaster St
- 46 Eugene St
- 210 6th St Unit C
- 14 Walker St
- 17 Vinton St
- 444 Central St Unit L
- 444 Central St Unit A & B
- 444 Central St Unit C
- 444 Central St Unit E
- 444 Central St Unit A
- 444 Central St Unit B-1
- 444 Central St Unit B
- 444 Central St Unit D
- 444 Central St Unit Whse
- 444 Central St Unit Retail
- 444 Central St Unit Whse B
- 444 Central St Unit A-1
- 52 Albert Dr
- 40 Albert Dr Unit 1A
- 40 Albert Dr
- 449 Central St
- 435 Central St
- 455 Central St
- 24 Albert Dr
- 464 Central St
Your Personal Tour Guide
Ask me questions while you tour the home.