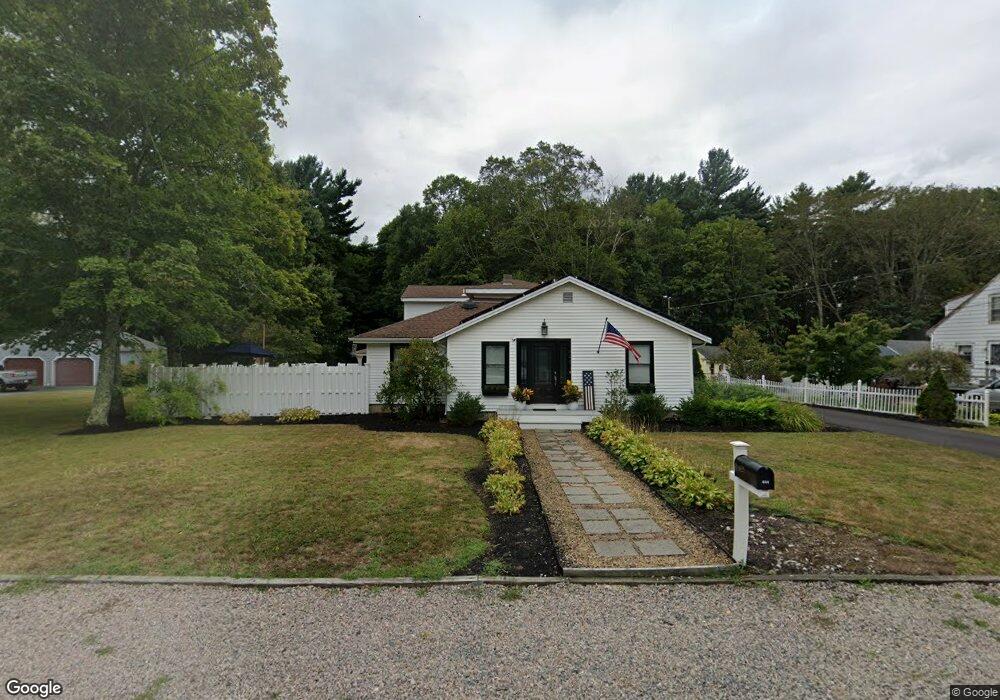
444 Circuit St Hanover, MA 02339
Estimated Value: $562,526 - $634,000
3
Beds
2
Baths
1,620
Sq Ft
$376/Sq Ft
Est. Value
About This Home
This home is located at 444 Circuit St, Hanover, MA 02339 and is currently estimated at $609,382, approximately $376 per square foot. 444 Circuit St is a home located in Plymouth County with nearby schools including Hanover High School and Cardinal Cushing Centers.
Ownership History
Date
Name
Owned For
Owner Type
Purchase Details
Closed on
Aug 31, 2021
Sold by
Smith Kimberley A and Smith Kevin A
Bought by
Mccormick Brian M and Mccormick Samantha M
Current Estimated Value
Home Financials for this Owner
Home Financials are based on the most recent Mortgage that was taken out on this home.
Original Mortgage
$434,150
Outstanding Balance
$395,044
Interest Rate
2.8%
Mortgage Type
Purchase Money Mortgage
Estimated Equity
$214,338
Purchase Details
Closed on
Jul 25, 2005
Sold by
Graham Donald K and Graham Carol A
Bought by
Smith Kimberley A and Smith Kevin A
Home Financials for this Owner
Home Financials are based on the most recent Mortgage that was taken out on this home.
Original Mortgage
$202,500
Interest Rate
5.59%
Mortgage Type
Purchase Money Mortgage
Purchase Details
Closed on
Apr 26, 1996
Sold by
Slaney Lawrence E and Johnson Beverly L
Bought by
Graham Carol A
Create a Home Valuation Report for This Property
The Home Valuation Report is an in-depth analysis detailing your home's value as well as a comparison with similar homes in the area
Home Values in the Area
Average Home Value in this Area
Purchase History
| Date | Buyer | Sale Price | Title Company |
|---|---|---|---|
| Mccormick Brian M | $457,000 | None Available | |
| Smith Kimberley A | $253,125 | -- | |
| Graham Carol A | $80,000 | -- |
Source: Public Records
Mortgage History
| Date | Status | Borrower | Loan Amount |
|---|---|---|---|
| Open | Mccormick Brian M | $434,150 | |
| Previous Owner | Graham Carol A | $30,000 | |
| Previous Owner | Graham Carol A | $202,500 |
Source: Public Records
Tax History
| Year | Tax Paid | Tax Assessment Tax Assessment Total Assessment is a certain percentage of the fair market value that is determined by local assessors to be the total taxable value of land and additions on the property. | Land | Improvement |
|---|---|---|---|---|
| 2025 | $5,275 | $427,100 | $255,900 | $171,200 |
| 2024 | $5,484 | $427,100 | $255,900 | $171,200 |
| 2023 | $5,009 | $371,300 | $232,800 | $138,500 |
| 2022 | $5,707 | $374,200 | $221,100 | $153,100 |
| 2021 | $5,319 | $325,700 | $179,900 | $145,800 |
| 2020 | $5,483 | $336,200 | $190,400 | $145,800 |
| 2019 | $8,192 | $317,200 | $190,400 | $126,800 |
| 2018 | $5,166 | $317,300 | $190,400 | $126,900 |
| 2017 | $4,906 | $297,000 | $182,200 | $114,800 |
| 2016 | $4,728 | $280,400 | $165,600 | $114,800 |
| 2015 | $4,104 | $254,100 | $153,400 | $100,700 |
Source: Public Records
Map
Nearby Homes
- 75 School St
- 95 Tecumseh Dr
- 127 King St
- 36 Grove St
- 51 Cervelli Farm Dr
- 37 Dr
- 23 Cervelli Farm Dr
- 38 Cervelli Farm Dr
- 9 Cervelli Farm Dr
- 250 Center St
- 108 Waterford Dr
- 823 Market St
- 696 Summer St
- 643 Summer St
- 139 Fairwood Dr
- 506 Main St
- 430 Brook Bend Rd
- 62 Larchmont Ln
- 810 Brookline Way
- 114 Graham Hill Dr
Your Personal Tour Guide
Ask me questions while you tour the home.