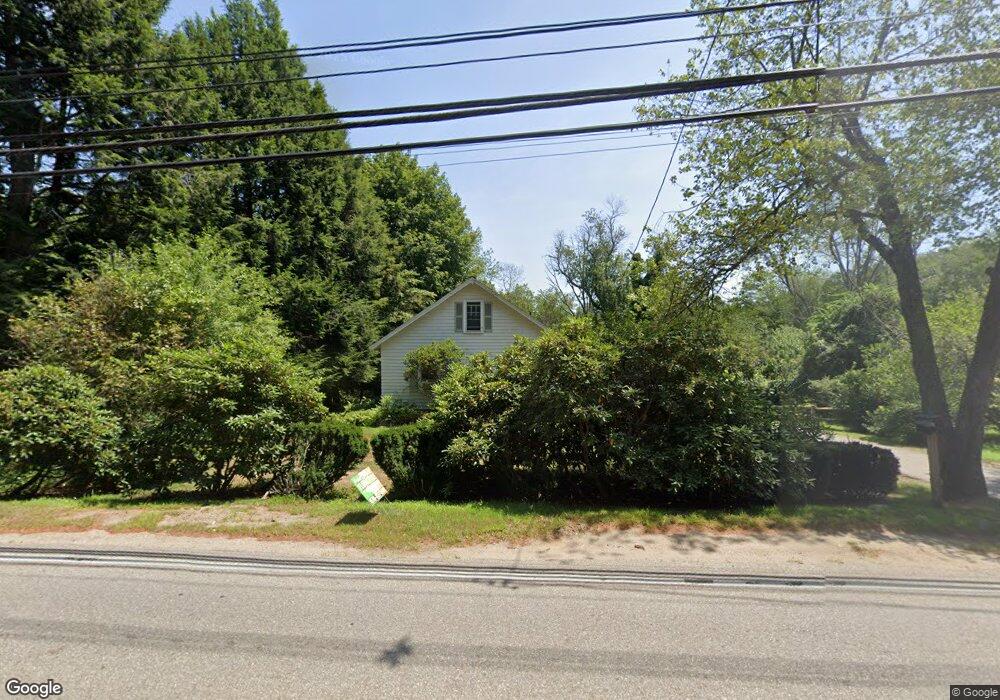
444 Concord Rd Sudbury, MA 01776
Estimated Value: $631,541 - $775,000
3
Beds
1
Bath
1,124
Sq Ft
$621/Sq Ft
Est. Value
About This Home
This home is located at 444 Concord Rd, Sudbury, MA 01776 and is currently estimated at $698,385, approximately $621 per square foot. 444 Concord Rd is a home located in Middlesex County with nearby schools including General John Nixon Elementary School, Ephraim Curtis Middle School, and Lincoln-Sudbury Regional High School.
Ownership History
Date
Name
Owned For
Owner Type
Purchase Details
Closed on
Jun 30, 1989
Sold by
Warren Elizabeth H
Bought by
Bensel Carolyn K
Current Estimated Value
Home Financials for this Owner
Home Financials are based on the most recent Mortgage that was taken out on this home.
Original Mortgage
$116,000
Interest Rate
10.56%
Mortgage Type
Purchase Money Mortgage
Create a Home Valuation Report for This Property
The Home Valuation Report is an in-depth analysis detailing your home's value as well as a comparison with similar homes in the area
Home Values in the Area
Average Home Value in this Area
Purchase History
| Date | Buyer | Sale Price | Title Company |
|---|---|---|---|
| Bensel Carolyn K | $145,000 | -- | |
| Bensel Carolyn K | $145,000 | -- |
Source: Public Records
Mortgage History
| Date | Status | Borrower | Loan Amount |
|---|---|---|---|
| Closed | Bensel Carolyn K | $114,500 | |
| Closed | Bensel Carolyn K | $116,000 |
Source: Public Records
Tax History Compared to Growth
Tax History
| Year | Tax Paid | Tax Assessment Tax Assessment Total Assessment is a certain percentage of the fair market value that is determined by local assessors to be the total taxable value of land and additions on the property. | Land | Improvement |
|---|---|---|---|---|
| 2025 | $6,477 | $442,400 | $317,300 | $125,100 |
| 2024 | $6,260 | $428,500 | $308,000 | $120,500 |
| 2023 | $6,133 | $388,900 | $279,900 | $109,000 |
| 2022 | $6,068 | $336,200 | $256,900 | $79,300 |
| 2021 | $5,965 | $316,800 | $256,900 | $59,900 |
| 2020 | $5,845 | $316,800 | $256,900 | $59,900 |
| 2019 | $7,896 | $316,800 | $256,900 | $59,900 |
| 2018 | $5,877 | $327,800 | $259,900 | $67,900 |
| 2017 | $7,669 | $317,700 | $250,900 | $66,800 |
| 2016 | $5,445 | $305,900 | $241,400 | $64,500 |
| 2015 | $5,000 | $284,100 | $243,600 | $40,500 |
| 2014 | $4,947 | $274,400 | $235,000 | $39,400 |
Source: Public Records
Map
Nearby Homes
- 427 Concord Rd
- 63 Canterbury Dr
- 24 Goodnow Rd
- 14 Frost Ln
- 270 Old Lancaster Rd
- 36 Old Forge Ln
- 94 Goodmans Hill Rd
- 941 Concord Rd
- 55 Widow Rites Ln
- 45 Widow Rites Ln
- Lot 5 Sailaway Ln
- 45 N Crescent Cir
- Lot 4 Sailaway Ln
- 2 Betts Way
- 8 Mina Way
- 0 Elm Unit 73282184
- Lot 9 Sailaway Ln
- 4 Betts Way
- 122 Sand Gully Rd N Unit B
- 10 Bradley Place