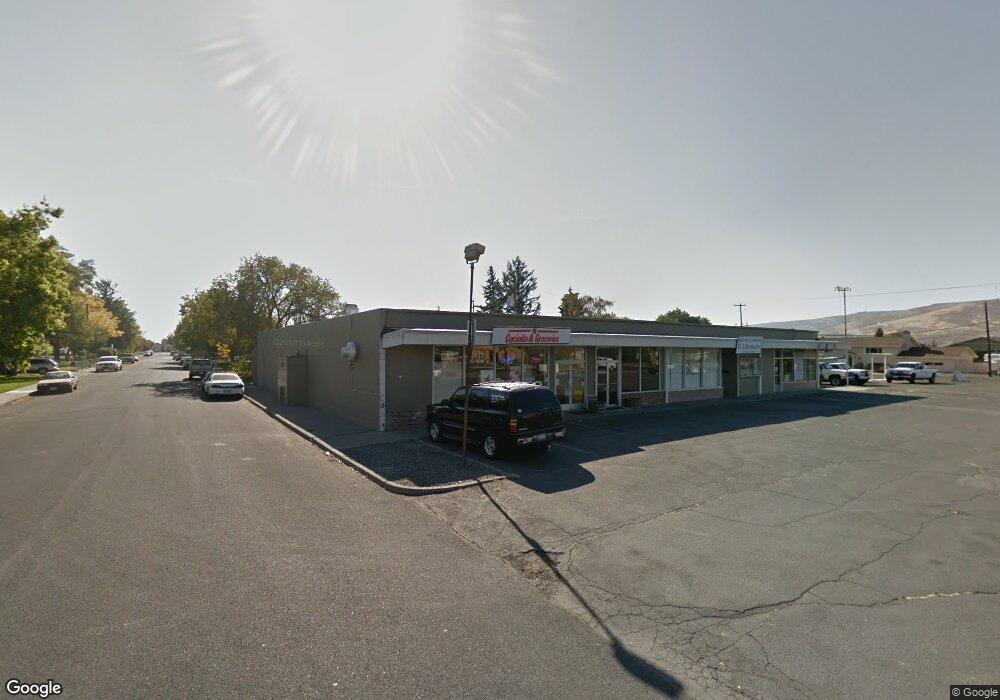
444 Division Ave E Ephrata, WA 98823
Estimated Value: $405,200
Studio
--
Bath
9,646
Sq Ft
$42/Sq Ft
Est. Value
About This Home
This home is located at 444 Division Ave E, Ephrata, WA 98823 and is currently estimated at $405,200, approximately $42 per square foot. 444 Division Ave E is a home located in Grant County with nearby schools including Ephrata High School, New Life Christian School, and St. Rose of Lima Catholic School.
Ownership History
Date
Name
Owned For
Owner Type
Purchase Details
Closed on
Jan 10, 2024
Sold by
Piturachsatit Suvicharn and Piturachsatit Deborah
Bought by
Pit Plaza Llc
Current Estimated Value
Purchase Details
Closed on
Dec 10, 2007
Sold by
Vu Luan Manh and Pham Tinh Thi
Bought by
Piturachsatit Suvicham and Piturachsatit Deborah
Purchase Details
Closed on
Jan 26, 2006
Sold by
Hammar Michael L and Hammar Rosalinda
Bought by
Vu Luan Mahn and Pham Tinh Thi
Home Financials for this Owner
Home Financials are based on the most recent Mortgage that was taken out on this home.
Original Mortgage
$170,000
Interest Rate
6.16%
Mortgage Type
Seller Take Back
Create a Home Valuation Report for This Property
The Home Valuation Report is an in-depth analysis detailing your home's value as well as a comparison with similar homes in the area
Purchase History
| Date | Buyer | Sale Price | Title Company |
|---|---|---|---|
| Pit Plaza Llc | -- | None Listed On Document | |
| Piturachsatit Suvicham | $200,000 | Chicago Title | |
| Vu Luan Mahn | $245,000 | Security Title Guara |
Source: Public Records
Mortgage History
| Date | Status | Borrower | Loan Amount |
|---|---|---|---|
| Previous Owner | Vu Luan Mahn | $170,000 |
Source: Public Records
Tax History
| Year | Tax Paid | Tax Assessment Tax Assessment Total Assessment is a certain percentage of the fair market value that is determined by local assessors to be the total taxable value of land and additions on the property. | Land | Improvement |
|---|---|---|---|---|
| 2025 | $2,252 | $214,880 | -- | -- |
| 2024 | $2,424 | $214,880 | $43,500 | $171,380 |
| 2023 | $2,470 | $202,270 | $43,500 | $158,770 |
| 2022 | $2,520 | $202,270 | $43,500 | $158,770 |
| 2021 | $2,364 | $202,270 | $43,500 | $158,770 |
| 2020 | $2,500 | $180,790 | $43,500 | $137,290 |
| 2019 | $1,918 | $180,790 | $43,500 | $137,290 |
| 2018 | $2,888 | $199,685 | $40,000 | $159,685 |
| 2017 | $2,707 | $199,685 | $40,000 | $159,685 |
| 2016 | $2,610 | $178,445 | $40,000 | $138,445 |
| 2013 | -- | $228,375 | $40,000 | $188,375 |
Source: Public Records
Map
Nearby Homes
- 129 G St SE
- 43 Crest Dr
- 147 E St SE
- 71 Ivy St NE
- 112 E St NE
- 123 F St NE
- 272 D St SE
- 0 Alder St SW
- 160 G St NE
- 28 Parkside Loop SE
- 241 Parkside Place SE
- 410 3rd Ave NE
- 247 Ivy St NE
- 238 Parkside Place SE
- 85 Linda Ridge Loop
- 309 5th Ave SE
- 40505 Basin St SW Unit 1-3
- 248 Pioneer Ave SE
- 811 5th Ave NE
- 285 A St SE
Your Personal Tour Guide
Ask me questions while you tour the home.