Estimated Value: $273,749 - $334,000
6
Beds
2
Baths
2,231
Sq Ft
$138/Sq Ft
Est. Value
About This Home
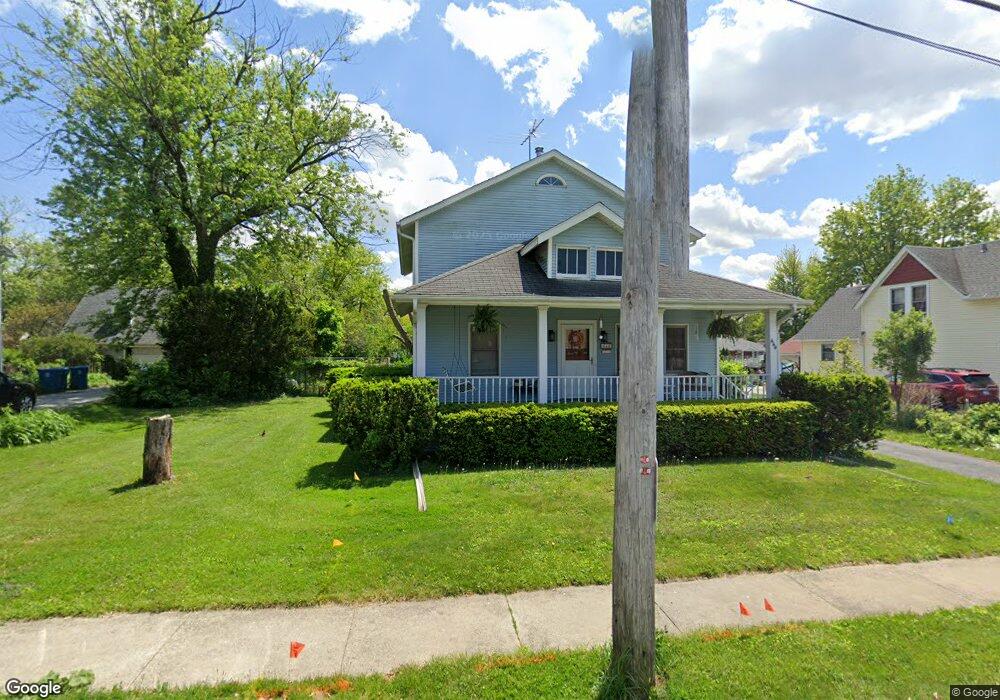
This home is located at 444 Division St, Crete, IL 60417 and is currently estimated at $307,937, approximately $138 per square foot. 444 Division St is a home located in Will County with nearby schools including Crete Elementary School, Crete-Monee Middle School, and Crete-Monee High School.
Ownership History
Date
Name
Owned For
Owner Type
Purchase Details
Closed on
Dec 16, 2008
Sold by
Clancy Susan K and Mcclure Susan K
Bought by
Griffin Daniel W and Griffin Katharine A
Current Estimated Value
Home Financials for this Owner
Home Financials are based on the most recent Mortgage that was taken out on this home.
Original Mortgage
$110,000
Outstanding Balance
$73,283
Interest Rate
6.3%
Mortgage Type
Purchase Money Mortgage
Estimated Equity
$234,654
Purchase Details
Closed on
Aug 22, 2003
Sold by
Clancy James A
Bought by
Clancy Susan
Purchase Details
Closed on
Sep 12, 1997
Sold by
Blievernicht Steven R and Blievernicht Jayne A
Bought by
Clancy James A and Clancy Susan
Home Financials for this Owner
Home Financials are based on the most recent Mortgage that was taken out on this home.
Original Mortgage
$140,000
Interest Rate
7.44%
Create a Home Valuation Report for This Property
The Home Valuation Report is an in-depth analysis detailing your home's value as well as a comparison with similar homes in the area
Home Values in the Area
Average Home Value in this Area
Purchase History
| Date | Buyer | Sale Price | Title Company |
|---|---|---|---|
| Griffin Daniel W | $168,000 | Real Property Title Llc | |
| Clancy Susan | -- | -- | |
| Clancy James A | $175,000 | -- |
Source: Public Records
Mortgage History
| Date | Status | Borrower | Loan Amount |
|---|---|---|---|
| Open | Griffin Daniel W | $110,000 | |
| Previous Owner | Clancy James A | $140,000 | |
| Closed | Clancy James A | $30,250 |
Source: Public Records
Tax History Compared to Growth
Tax History
| Year | Tax Paid | Tax Assessment Tax Assessment Total Assessment is a certain percentage of the fair market value that is determined by local assessors to be the total taxable value of land and additions on the property. | Land | Improvement |
|---|---|---|---|---|
| 2024 | $8,852 | $92,383 | $17,692 | $74,691 |
| 2023 | $8,852 | $82,492 | $15,798 | $66,694 |
| 2022 | $7,880 | $73,313 | $14,040 | $59,273 |
| 2021 | $7,448 | $67,124 | $12,855 | $54,269 |
| 2020 | $7,203 | $62,909 | $12,048 | $50,861 |
| 2019 | $6,962 | $59,125 | $11,323 | $47,802 |
| 2018 | $6,813 | $57,517 | $11,079 | $46,438 |
| 2017 | $6,437 | $52,986 | $10,206 | $42,780 |
| 2016 | $6,395 | $52,644 | $10,140 | $42,504 |
| 2015 | $6,190 | $51,235 | $9,869 | $41,366 |
| 2014 | $6,190 | $51,753 | $9,969 | $41,784 |
| 2013 | $6,190 | $54,231 | $10,446 | $43,785 |
Source: Public Records
Map
Nearby Homes
- 1361 Elizabeth St
- 432 Herman St
- 1321 Wood St
- 381 W Exchange St
- 514 North St
- 1378 East St
- 1322 Benton St
- 20 Joe Orr Ct
- 1402 apx W Exchange St
- 574 Herman St
- 520 Craig Ave
- 1512 Vincennes St
- 1404 (apx) W Exchange St
- 1400 (apx) W Exchange St
- 280 W Exchange St
- 1610 Hewes St
- 378 Oakwood Dr
- 354 Oakwood Dr
- 1307 Dairy Ln
- 660 1st St
- 450 Division St
- 438 Division St
- 456 Division St
- 1430 Elizabeth St
- 1431 Wood St
- 1435 Wood St
- 428 Division St
- 1434 Elizabeth St
- 1429 Elizabeth St
- 1440 Elizabeth St
- 1441 Wood St
- 1433 Elizabeth St
- 1420 Wood St
- 1430 Wood St
- 1437 Elizabeth St
- 1443 Wood St
- 1444 Elizabeth St
- 1434 Wood St
- 416 Division St
- 1424 Park St