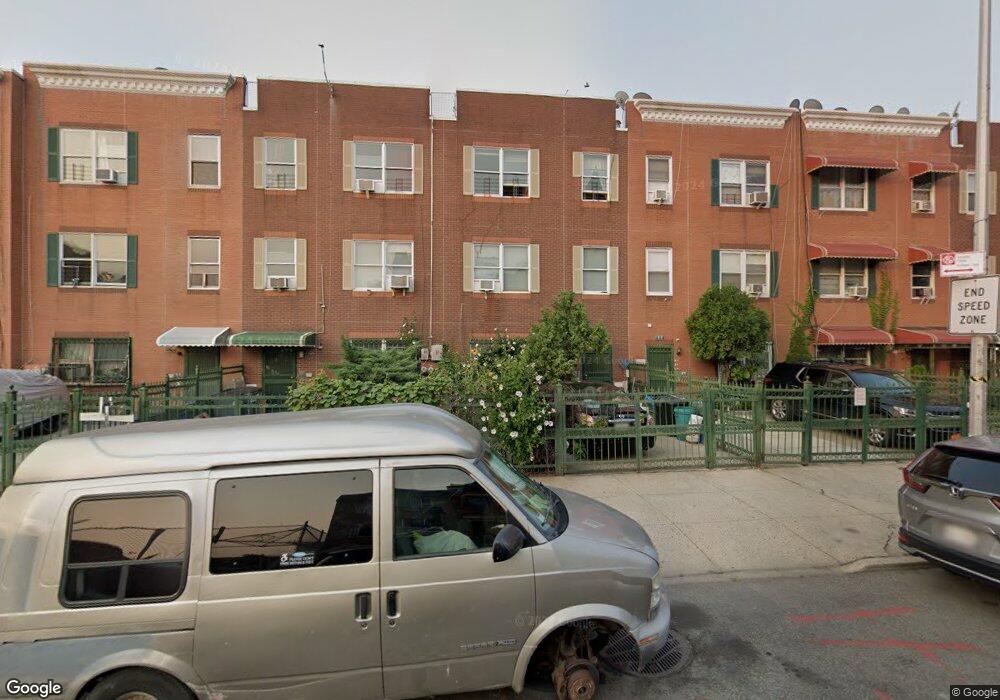
444 E 141st St Bronx, NY 10454
Mott Haven NeighborhoodEstimated Value: $939,704 - $1,167,000
Studio
--
Bath
2,700
Sq Ft
$394/Sq Ft
Est. Value
About This Home
This home is located at 444 E 141st St, Bronx, NY 10454 and is currently estimated at $1,062,926, approximately $393 per square foot. 444 E 141st St is a home located in Bronx County with nearby schools including P.S. I.S. 224, Academy of Applied Mathematics and Technology, and Middle School 223 Laboratory School of Finance and Technology.
Ownership History
Date
Name
Owned For
Owner Type
Purchase Details
Closed on
Dec 19, 2015
Sold by
Franco Cecilia and Marin Agustin
Bought by
Franco Cecilia and Franco Elvia
Current Estimated Value
Purchase Details
Closed on
Jun 27, 2007
Sold by
Franco Cecilia
Bought by
Franco Cecilia and Marin Agustin
Purchase Details
Closed on
Oct 11, 2005
Sold by
Grti Group Holding Llc
Bought by
Franco Cecilia
Home Financials for this Owner
Home Financials are based on the most recent Mortgage that was taken out on this home.
Original Mortgage
$420,800
Interest Rate
6.28%
Mortgage Type
Purchase Money Mortgage
Purchase Details
Closed on
Jun 17, 2003
Sold by
Jp Morgan Chase Bank
Bought by
Grti Group Holding Llc
Purchase Details
Closed on
Mar 11, 2003
Sold by
Rosetti Esq
Bought by
Jp Morgan Chase Bank
Create a Home Valuation Report for This Property
The Home Valuation Report is an in-depth analysis detailing your home's value as well as a comparison with similar homes in the area
Home Values in the Area
Average Home Value in this Area
Purchase History
| Date | Buyer | Sale Price | Title Company |
|---|---|---|---|
| Franco Cecilia | -- | -- | |
| Franco Cecilia | -- | -- | |
| Franco Cecilia | $526,000 | -- | |
| Grti Group Holding Llc | $300,000 | -- | |
| Jp Morgan Chase Bank | $242,000 | -- |
Source: Public Records
Mortgage History
| Date | Status | Borrower | Loan Amount |
|---|---|---|---|
| Previous Owner | Franco Cecilia | $420,800 | |
| Closed | Jp Morgan Chase Bank | $0 |
Source: Public Records
Tax History
| Year | Tax Paid | Tax Assessment Tax Assessment Total Assessment is a certain percentage of the fair market value that is determined by local assessors to be the total taxable value of land and additions on the property. | Land | Improvement |
|---|---|---|---|---|
| 2025 | $5,883 | $31,046 | $3,945 | $27,101 |
| 2024 | $5,883 | $29,290 | $4,436 | $24,854 |
| 2023 | $5,949 | $29,290 | $3,814 | $25,476 |
| 2022 | $5,803 | $50,700 | $7,860 | $42,840 |
| 2021 | $5,771 | $53,220 | $7,860 | $45,360 |
| 2020 | $5,476 | $48,120 | $7,860 | $40,260 |
| 2019 | $5,106 | $44,220 | $7,860 | $36,360 |
| 2018 | $4,976 | $24,408 | $4,957 | $19,451 |
| 2017 | $4,938 | $24,224 | $6,959 | $17,265 |
| 2016 | $4,569 | $22,853 | $5,575 | $17,278 |
| 2015 | $1,919 | $21,560 | $6,727 | $14,833 |
| 2014 | $1,919 | $20,340 | $5,741 | $14,599 |
Source: Public Records
Map
Nearby Homes
- 436 E 141st St
- 419 E 140th St
- 410 E 141st St
- 409 E 139th St
- 443 E 143rd St
- 463 E 143rd St
- 430 E 144th St
- 408 E 138th St
- 522 E 139th St
- 342 E 141st St
- 339 E 140th St
- 446 E 146th St
- 442 E 136th St
- 430 E 136th St
- 412 E 136th St
- 596 Beech Terrace
- 11156 E 145th St
- 608 E 140th St
- 439 E 147th St
- 523 E 148th St
- 446 E 141st St
- 448 E 141st St
- 448 E 141st St Unit 3
- 448 E 141st St Unit 1
- 448 E 141 St St Unit 3
- 448 E 141 St St Unit 1
- 442 E 141st St
- 450 E 141st St
- 440 E 141st St
- 440 E 141st St Unit A
- 452 E 141st St
- 438 E 141st St
- 454 E 141st St
- 454 E 141st St
- 456 E 141st St
- 445 E 140th St
- 441 E 140th St
- 451 E 140th St
- 434 E 141st St
- 455 E 140th St
Your Personal Tour Guide
Ask me questions while you tour the home.