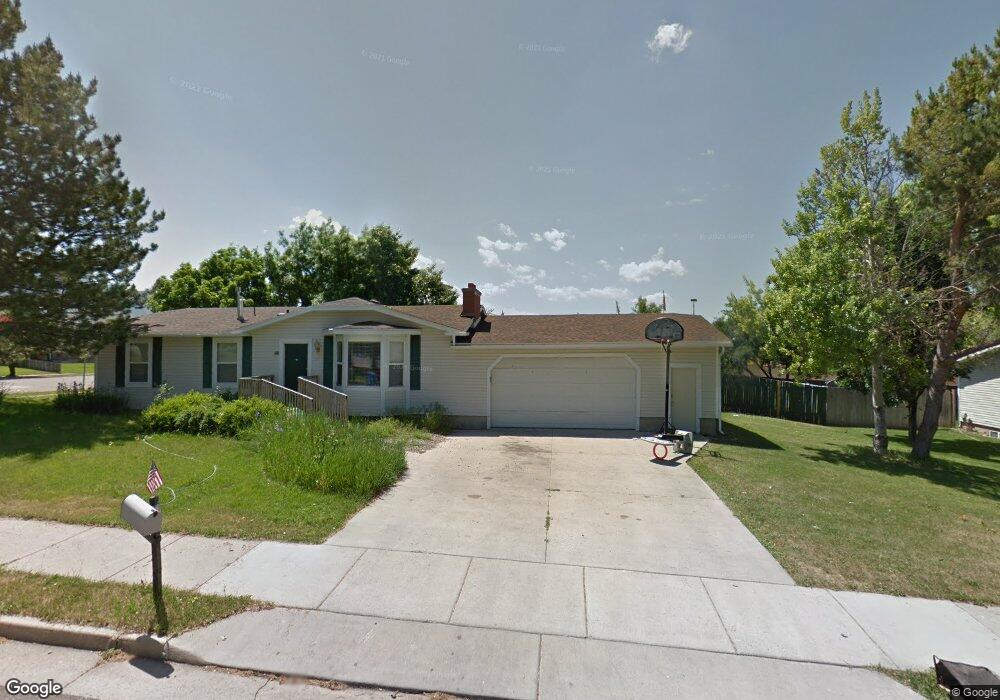
444 E 180 S Smithfield, UT 84335
Estimated Value: $395,392 - $423,000
5
Beds
2
Baths
2,524
Sq Ft
$164/Sq Ft
Est. Value
About This Home
This home is located at 444 E 180 S, Smithfield, UT 84335 and is currently estimated at $413,098, approximately $163 per square foot. 444 E 180 S is a home located in Cache County with nearby schools including Sunrise School, Cedar Ridge School, and North Cache Middle School.
Ownership History
Date
Name
Owned For
Owner Type
Purchase Details
Closed on
Mar 25, 2011
Sold by
Kent Emily and Kent Mikal S
Bought by
Kent Mikal S and Kent Emily
Current Estimated Value
Purchase Details
Closed on
May 20, 2010
Sold by
Wade Franky K and Wade Sharon A
Bought by
Kent Emily and Kent Mikal S
Home Financials for this Owner
Home Financials are based on the most recent Mortgage that was taken out on this home.
Original Mortgage
$170,000
Outstanding Balance
$123,945
Interest Rate
5.21%
Mortgage Type
Purchase Money Mortgage
Estimated Equity
$289,153
Purchase Details
Closed on
Dec 16, 2008
Sold by
Brent M Wadsworth Family Partnership
Bought by
Wade Franky K and Wade Sharon A
Home Financials for this Owner
Home Financials are based on the most recent Mortgage that was taken out on this home.
Original Mortgage
$133,900
Interest Rate
6.47%
Mortgage Type
Seller Take Back
Create a Home Valuation Report for This Property
The Home Valuation Report is an in-depth analysis detailing your home's value as well as a comparison with similar homes in the area
Home Values in the Area
Average Home Value in this Area
Purchase History
| Date | Buyer | Sale Price | Title Company |
|---|---|---|---|
| Kent Mikal S | -- | None Available | |
| Kent Emily | -- | Advanced Title | |
| Wade Franky K | -- | American Secure Title | |
| Brent M Wadsworth Family Partnership | -- | American Secure Title |
Source: Public Records
Mortgage History
| Date | Status | Borrower | Loan Amount |
|---|---|---|---|
| Open | Kent Emily | $170,000 | |
| Previous Owner | Wade Franky K | $133,900 |
Source: Public Records
Tax History
| Year | Tax Paid | Tax Assessment Tax Assessment Total Assessment is a certain percentage of the fair market value that is determined by local assessors to be the total taxable value of land and additions on the property. | Land | Improvement |
|---|---|---|---|---|
| 2025 | $1,534 | $205,400 | $0 | $0 |
| 2024 | $1,497 | $188,040 | $0 | $0 |
| 2023 | $1,537 | $182,560 | $0 | $0 |
| 2022 | $1,562 | $182,560 | $0 | $0 |
| 2021 | $1,521 | $271,480 | $70,000 | $201,480 |
| 2020 | $1,429 | $237,900 | $70,000 | $167,900 |
| 2019 | $1,290 | $204,759 | $50,000 | $154,759 |
| 2018 | $1,180 | $181,152 | $50,000 | $131,152 |
| 2017 | $1,096 | $91,905 | $0 | $0 |
| 2016 | $1,115 | $91,905 | $0 | $0 |
| 2015 | $1,120 | $91,905 | $0 | $0 |
| 2014 | $1,026 | $85,935 | $0 | $0 |
| 2013 | -- | $85,935 | $0 | $0 |
Source: Public Records
Map
Nearby Homes
Your Personal Tour Guide
Ask me questions while you tour the home.