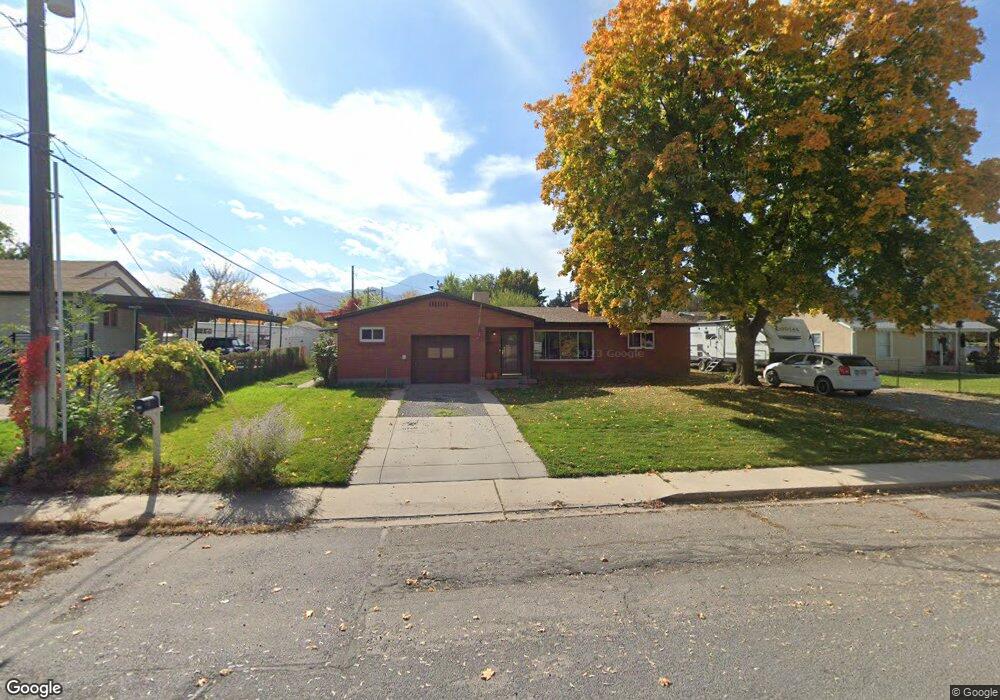
444 E 400 S Payson, UT 84651
Estimated Value: $359,000 - $412,000
3
Beds
2
Baths
1,512
Sq Ft
$258/Sq Ft
Est. Value
About This Home
This home is located at 444 E 400 S, Payson, UT 84651 and is currently estimated at $390,199, approximately $258 per square foot. 444 E 400 S is a home located in Utah County with nearby schools including Park View Elementary, Payson Junior High School, and Mt. Nebo Middle.
Ownership History
Date
Name
Owned For
Owner Type
Purchase Details
Closed on
Sep 17, 2015
Sold by
Averett Kevin Kay
Bought by
Averett Kevin Kay and Averett Shantelle Elizabeth
Current Estimated Value
Home Financials for this Owner
Home Financials are based on the most recent Mortgage that was taken out on this home.
Original Mortgage
$142,373
Outstanding Balance
$111,748
Interest Rate
3.89%
Mortgage Type
FHA
Estimated Equity
$278,451
Purchase Details
Closed on
Jan 27, 1992
Sold by
Gay Morden S
Bought by
Gay Morden Leon and Gay Carter Nina Enone
Create a Home Valuation Report for This Property
The Home Valuation Report is an in-depth analysis detailing your home's value as well as a comparison with similar homes in the area
Home Values in the Area
Average Home Value in this Area
Purchase History
| Date | Buyer | Sale Price | Title Company |
|---|---|---|---|
| Averett Kevin Kay | -- | Wasatch Land & Title | |
| Averett Kevin Kay | -- | Wasatch Land & Title | |
| Gay Morden Leon | -- | None Available |
Source: Public Records
Mortgage History
| Date | Status | Borrower | Loan Amount |
|---|---|---|---|
| Open | Averett Kevin Kay | $142,373 |
Source: Public Records
Tax History
| Year | Tax Paid | Tax Assessment Tax Assessment Total Assessment is a certain percentage of the fair market value that is determined by local assessors to be the total taxable value of land and additions on the property. | Land | Improvement |
|---|---|---|---|---|
| 2025 | $1,793 | $186,890 | -- | -- |
| 2024 | $1,793 | $182,435 | $0 | $0 |
| 2023 | $1,858 | $189,585 | $0 | $0 |
| 2022 | $1,969 | $197,670 | $0 | $0 |
| 2021 | $1,640 | $264,000 | $90,800 | $173,200 |
| 2020 | $1,563 | $246,200 | $82,500 | $163,700 |
| 2019 | $1,328 | $214,400 | $71,200 | $143,200 |
| 2018 | $1,186 | $184,500 | $60,000 | $124,500 |
| 2017 | $1,091 | $91,300 | $0 | $0 |
| 2016 | $1,064 | $88,440 | $0 | $0 |
| 2015 | $951 | $78,540 | $0 | $0 |
| 2014 | $851 | $70,785 | $0 | $0 |
Source: Public Records
Map
Nearby Homes
Your Personal Tour Guide
Ask me questions while you tour the home.